

Scalable Urban Tree Canopy Model for Canadian Cities
Bayan Shaeri (B.Ed), Yuhao Lu (PI)
Collaborators: Alex Martin (University of Toronto + University of Oxford); Lukas Olson (University of British Columbia); Raphael Ayambire (University of Manitoba); Txomin Hermosilla (Canada Forest Services); Lucila Corro (USGS); Jay Diffendorfer (USGS); Peter Ibsen (USGS)
(June 2026)
Why urban tree canopy (UTC) matters: Urban tree cover, defined as the percentage of a city shaded by tree canopies plays a crucial role in keeping cities livable and sustainable. Tree canopies help cool neighbourhoods during heat waves, improve air quality, store carbon, and create habitat for birds and wildlife. Because of these benefits, many cities set long-term canopy cover targets. For example, Vancouver aims to reach 22% tree canopy by 2050. To track progress and make smart decisions, governments and researchers need accurate and up-to-date maps of where tree canopy exists in the city, and how much there is. These maps are commonly derived from city-wide UTC datasets.
How were tree covers mapped in the past: For decades, people have been measuring urban tree cover using a variety of methods. Some use historical aerial photographs or field surveys where people count trees or trace their outlines by hand. These methods can be very accurate, but they’re also time-consuming and expensive for large areas specially when working across large cities or entire regions. Tools such as i-Tree Canopy help automate some of this work using photo interpretation, but still require hundreds or even thousands of sample points per city. More advanced technologies like drones, LiDAR (laser scanning), and high-resolution satellite imagery can generate 2D and even 3D maps of urban trees even down to the individual tree scale. These approaches are precise, but they also require costly equipment, skilled operators, and often aren’t available for smaller communities or for all years.
A scalable, satellite-based, machine learning UTC workflow: Thanks to openly available satellite imagery from programs like Landsat and Sentinel, and cloud computing platforms like Google Earth Engine, it’s now possible to map tree canopy cover across many cities more efficiently. Our research builds on this potential by combining satellite images with Random Forest machine learning models to estimate tree cover in a consistent and repeatable way. We tested this method in 19 cities across Canada’s 8 (out of 15) eco-zones, representing different climates, eco-zones, population sizes, and development patterns. The result is a set of spatially detailed maps showing the percent canopy cover in each part of the city, using a standardized grid system (120 m x 120m). These maps are scalable, and designed to be updated over time as new imagery becomes available.
Benefits: Having a consistent method to map and compare UTC across cities helps researchers, policymakers, and communities understand where trees are growing and where they’re not. It also helps answer important questions such as: “Are low-income neighbourhoods getting enough tree cover? How is urban development affecting green space? Are cities on track to meet their canopy goals?” Unlike older methods or datasets that only focus on street trees or public lands, our approach maps all canopies (over 2m tall), including those from trees in parks, backyards, and institutional lands. This provides a more complete picture of urban trees and their benefits. Our project demonstrates that accurate, repeatable, and open urban tree data is now within reach, without the need for expensive equipment or manual tracing. Because it’s based on open data and open tools, it can be expanded, adapted, and improved by others working on urban forestry in Canada and around the world.
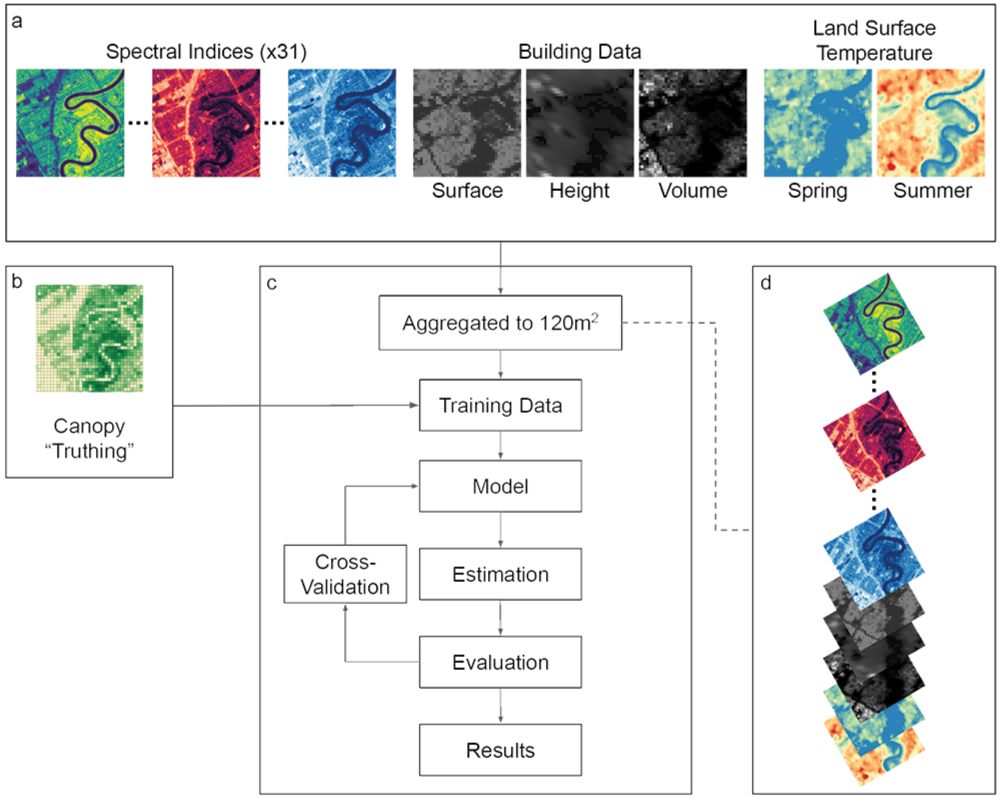
A canopy mask (binary layer) was created to calculate the actual canopy cover (%) based on the 1-m CHM for each city.
Input datasets (spectral indices, building data, and land surface temperature) were aggregated into 120 m grid cells. Tolan et al. (2024) canopy height model was used as training data for the model. Three cities’ local aerial laser scanning data were also used for a secondary validation.
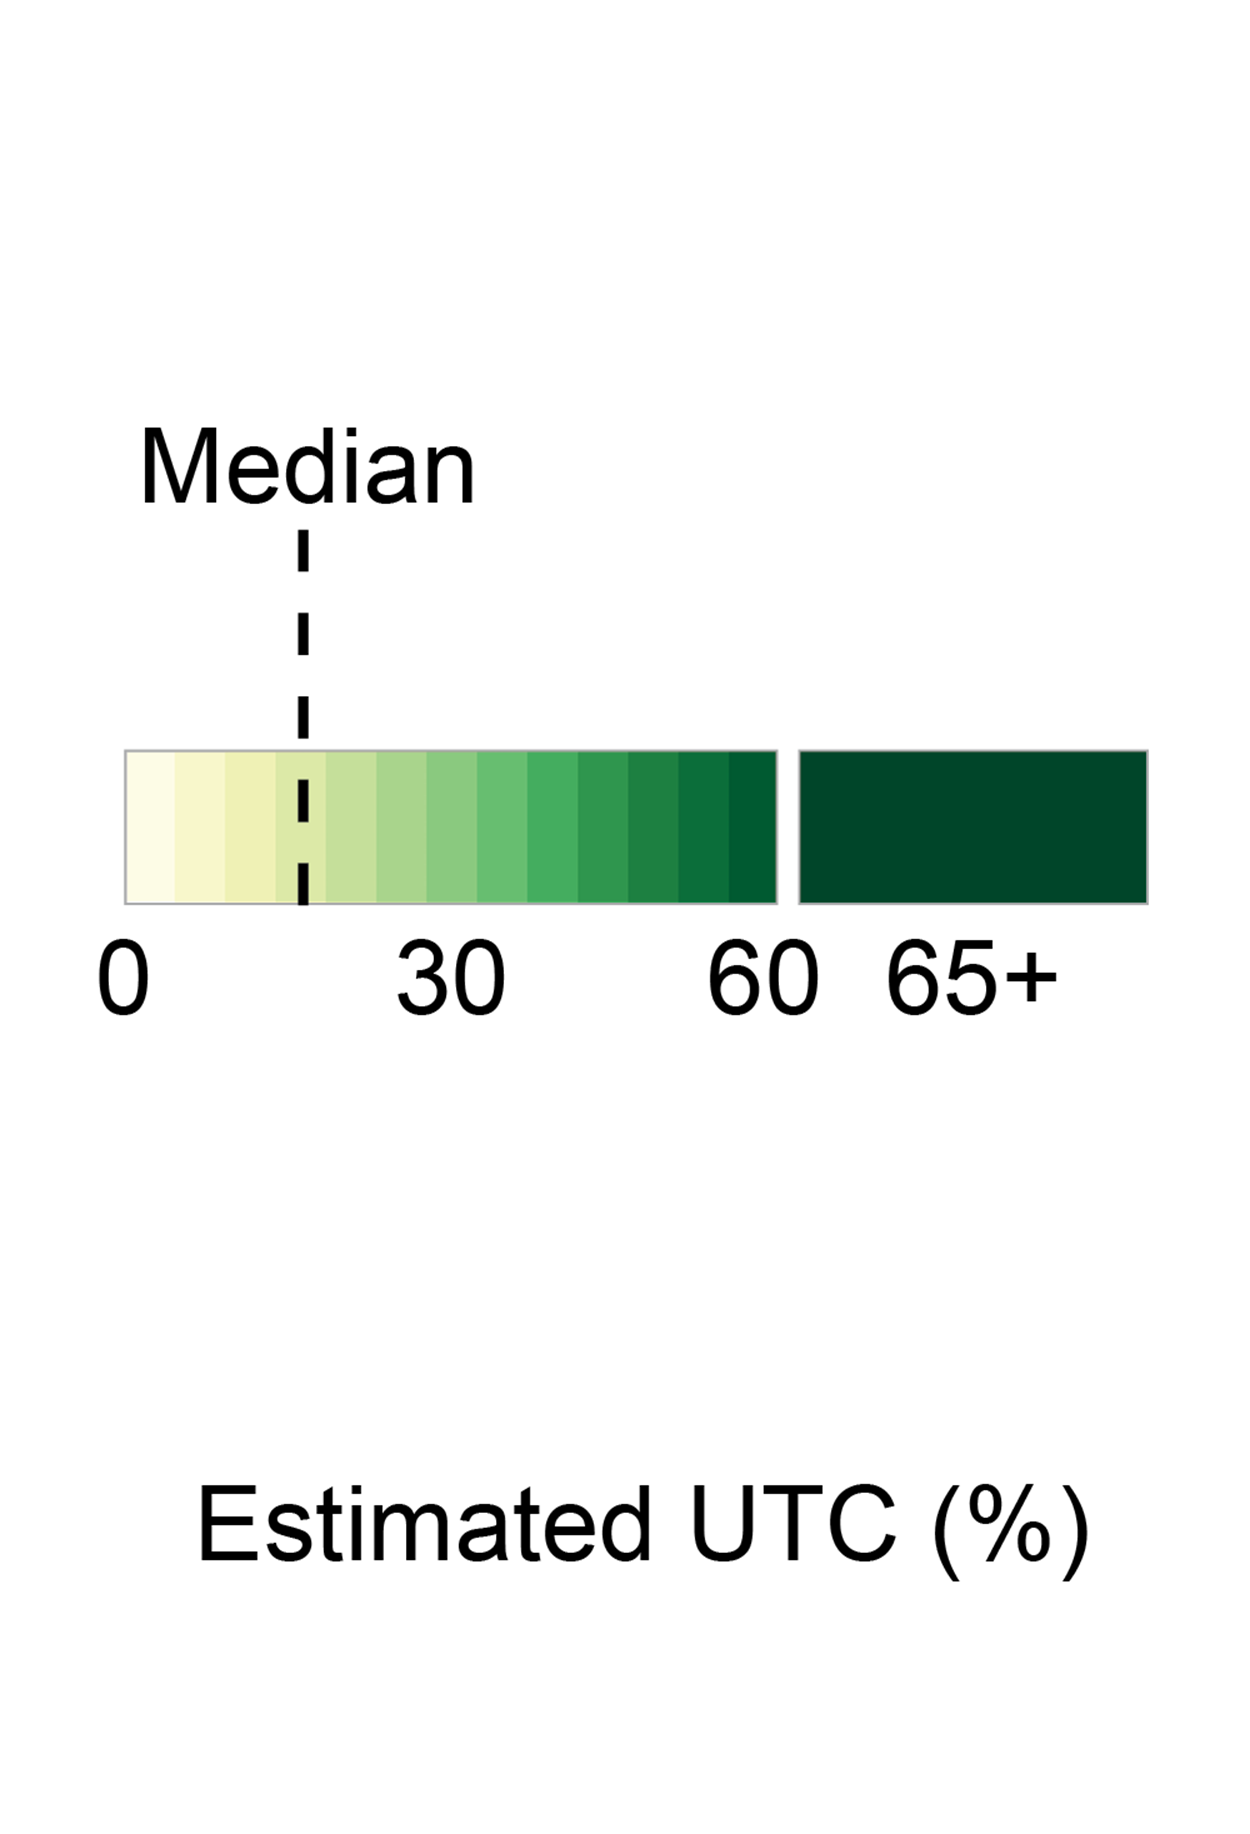
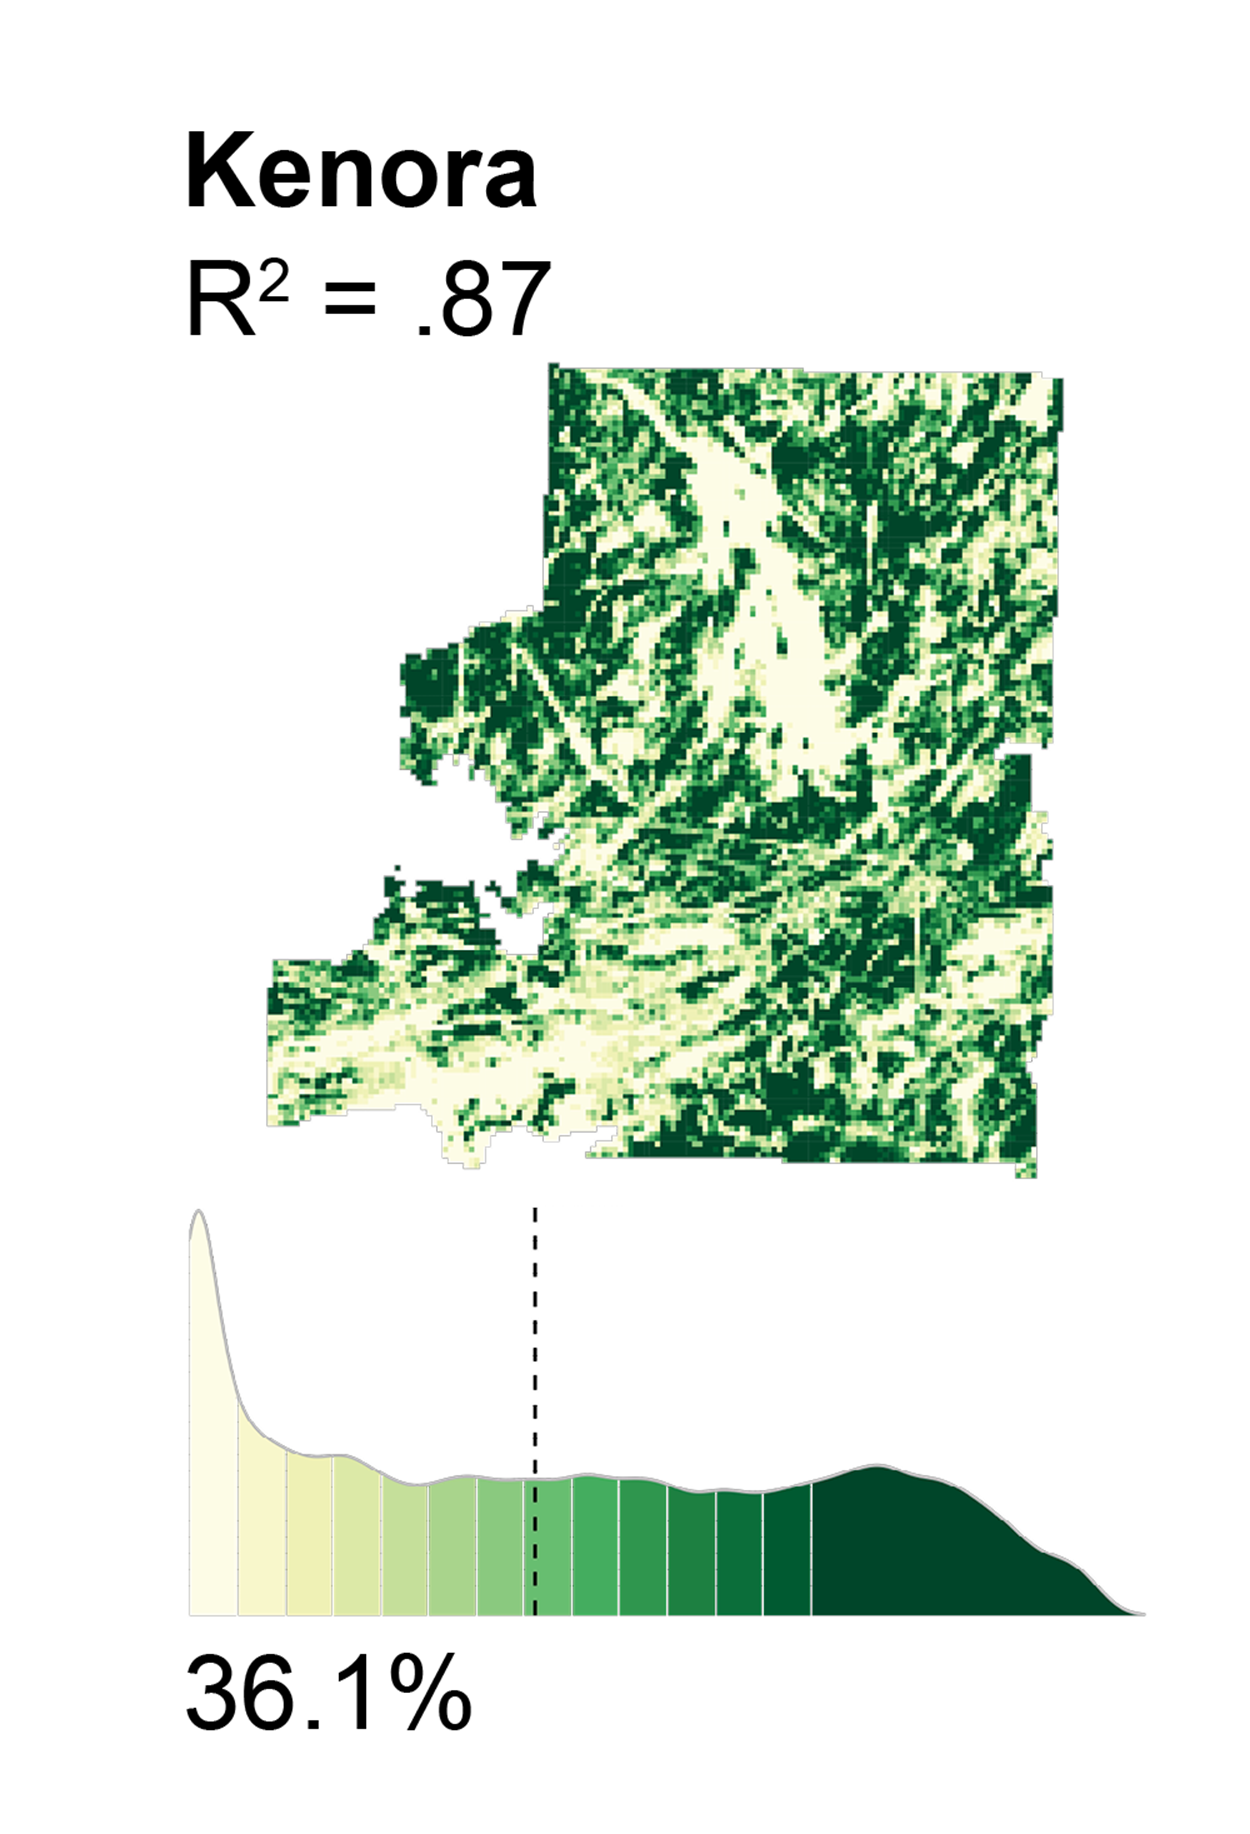
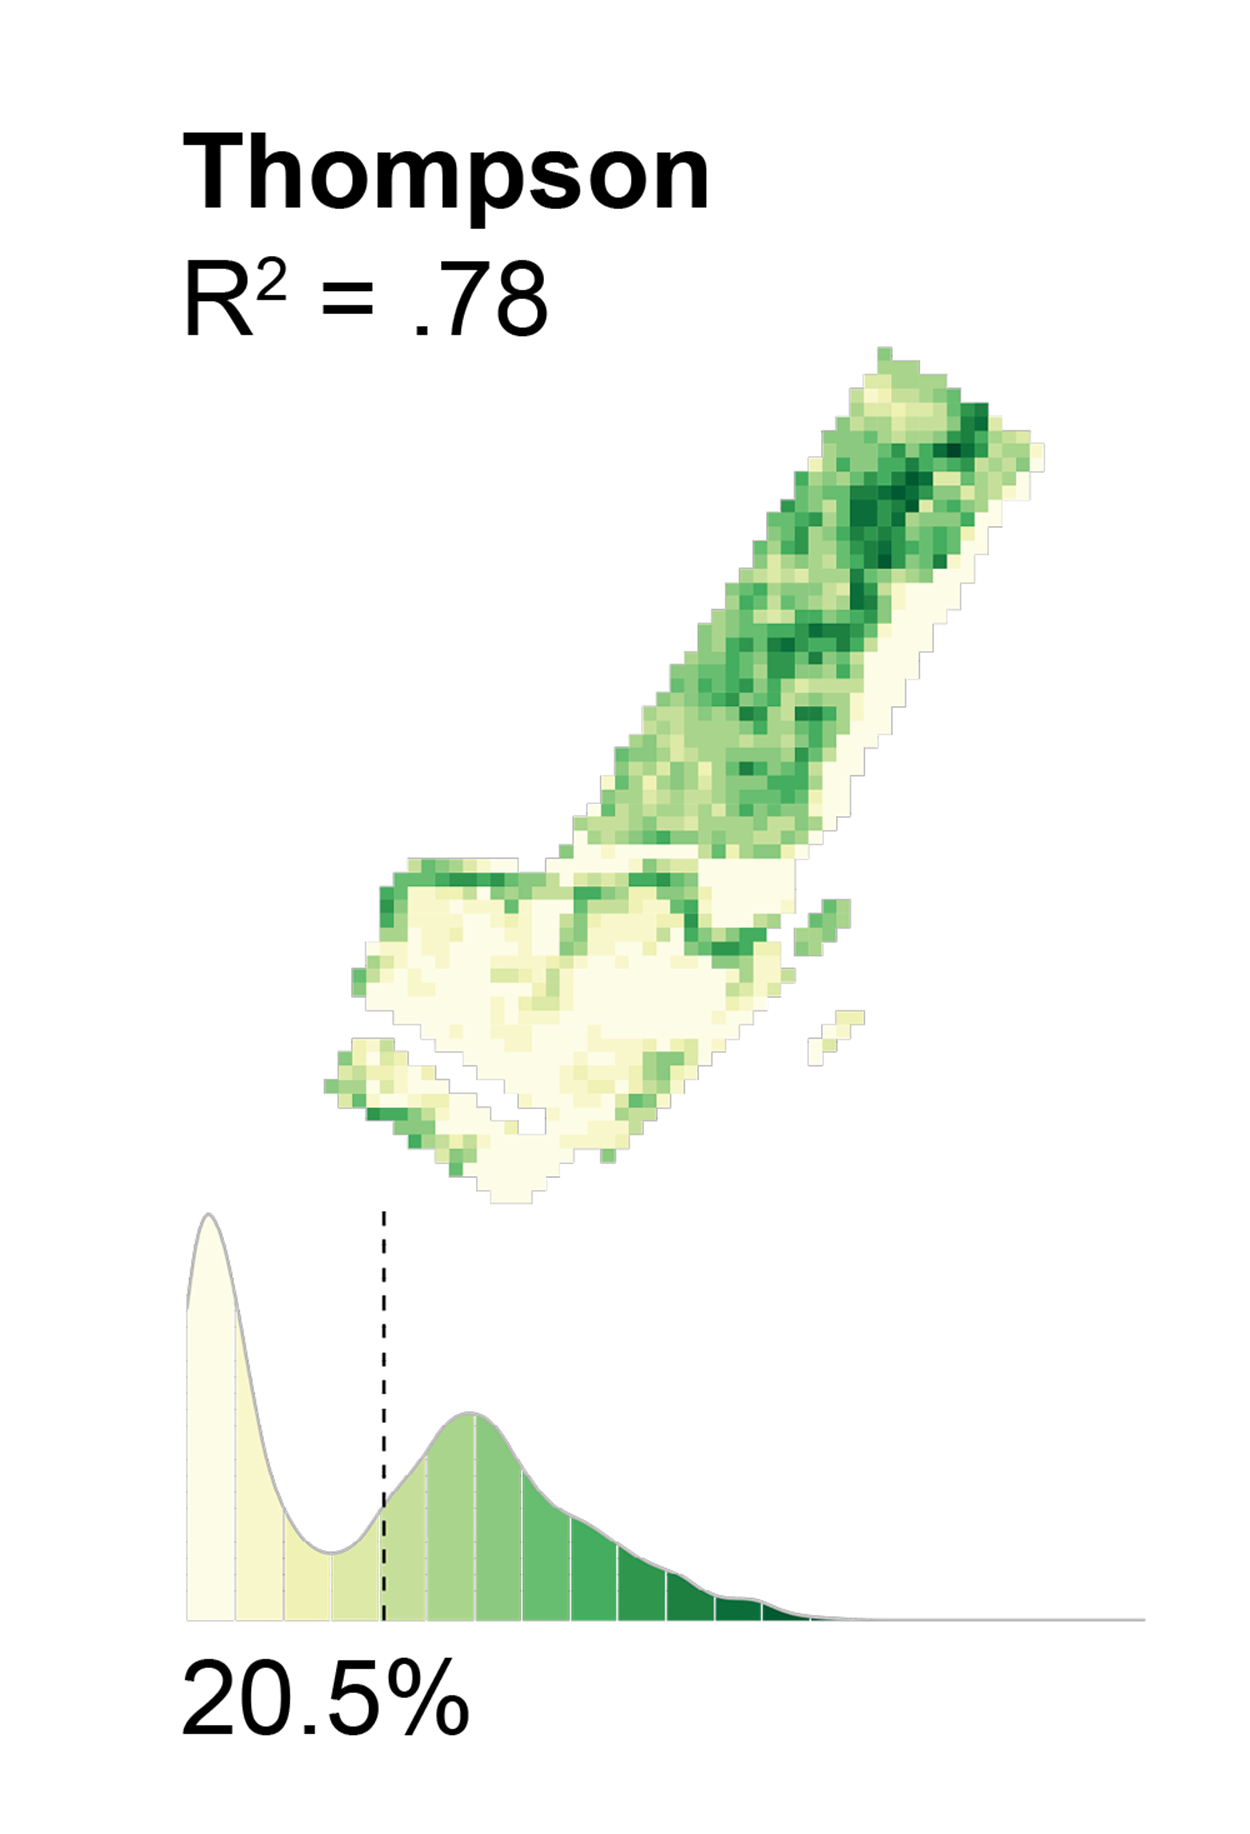
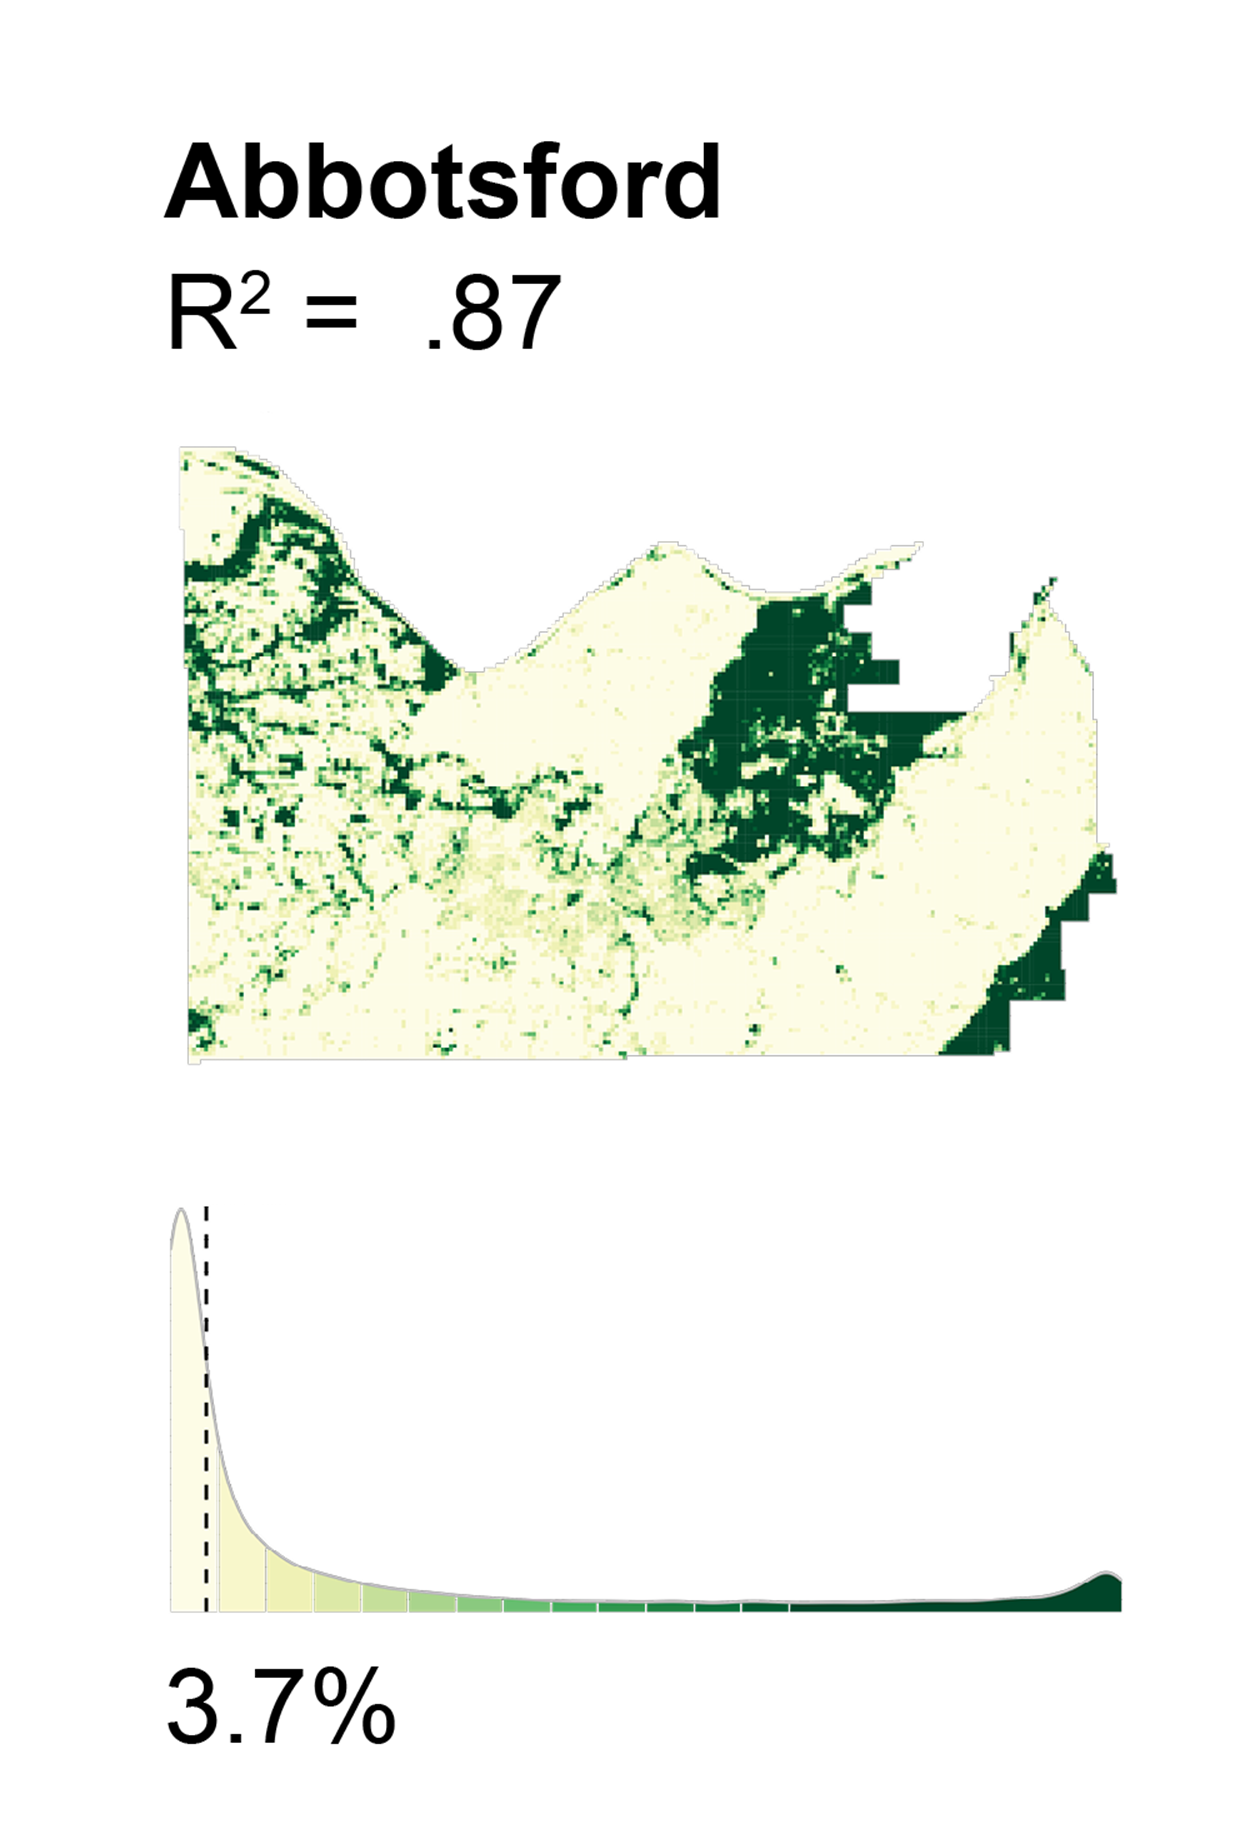
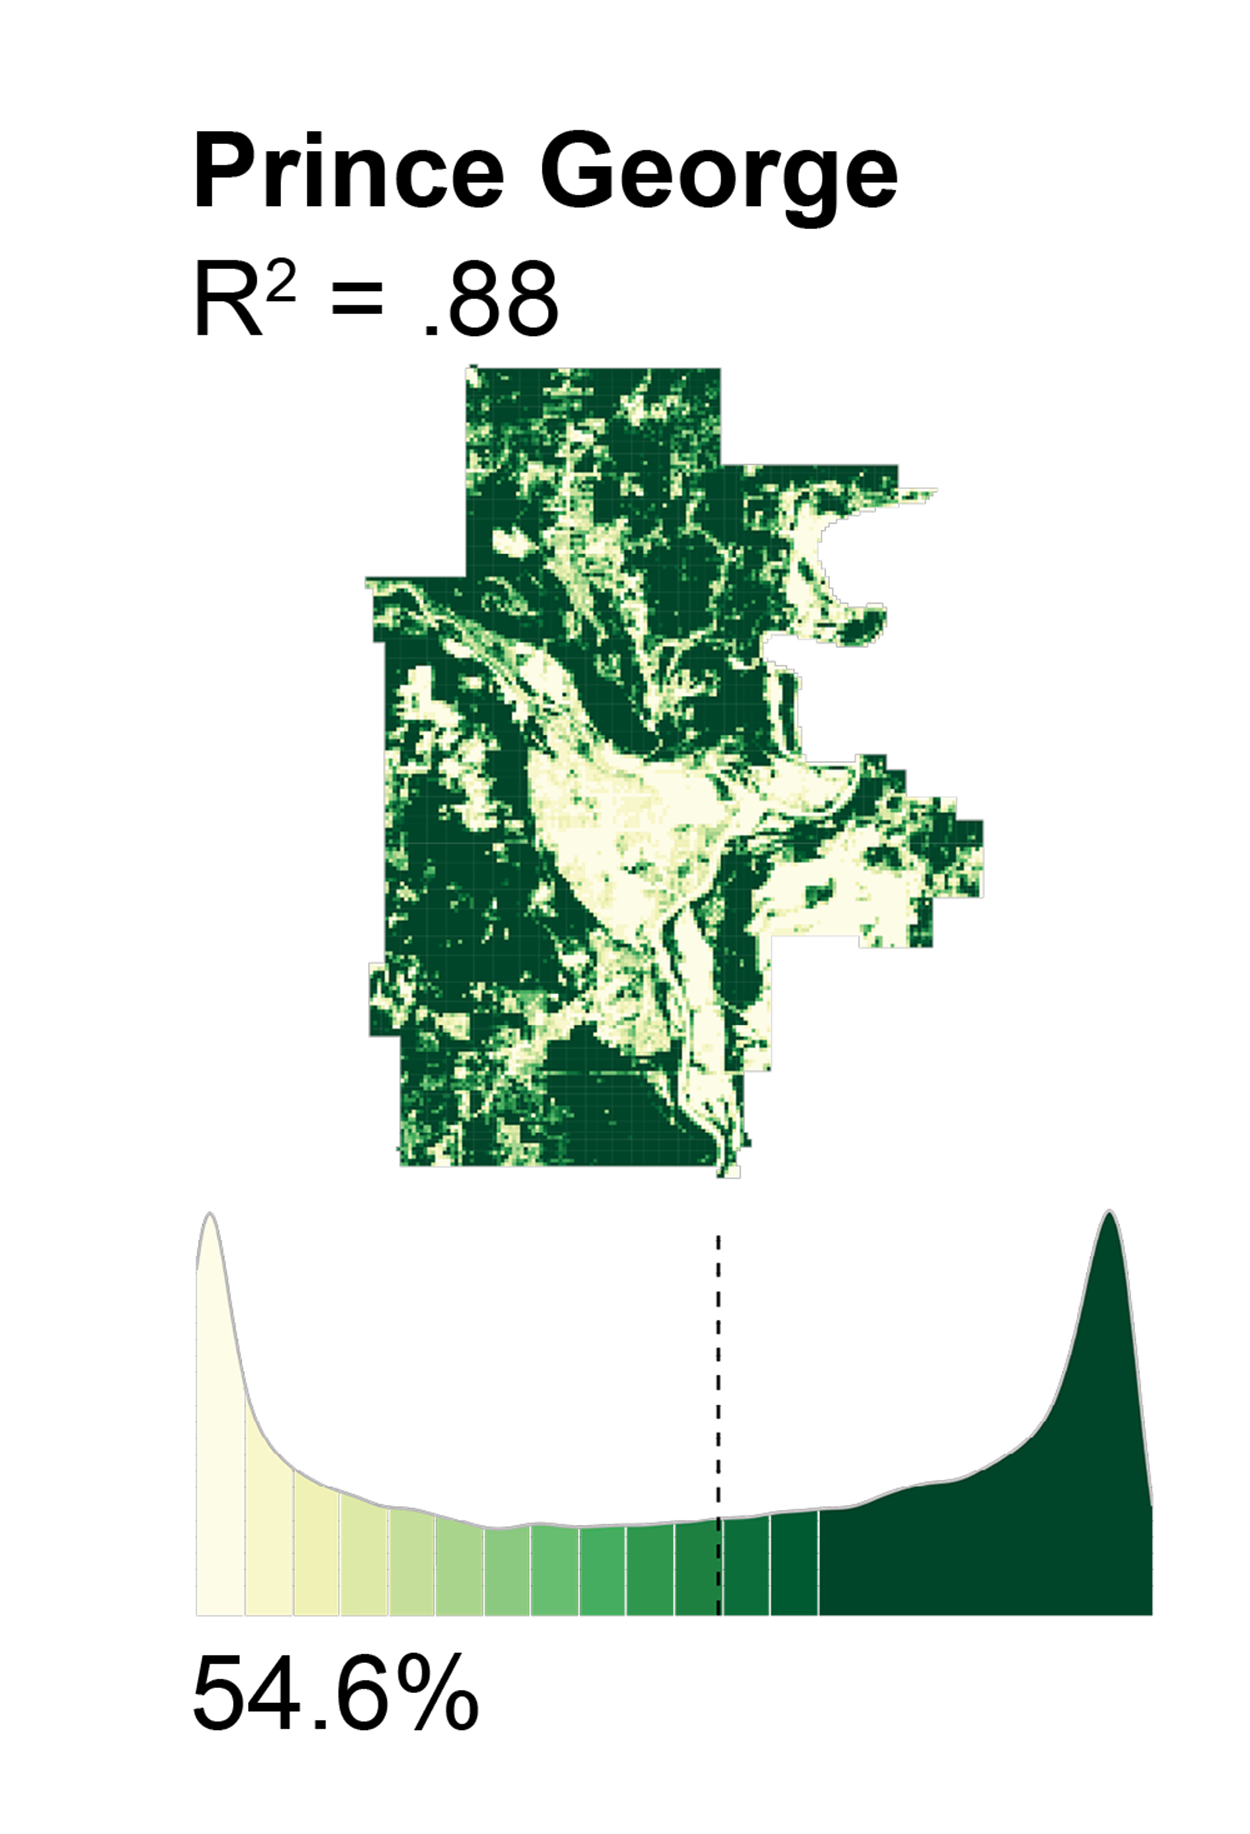
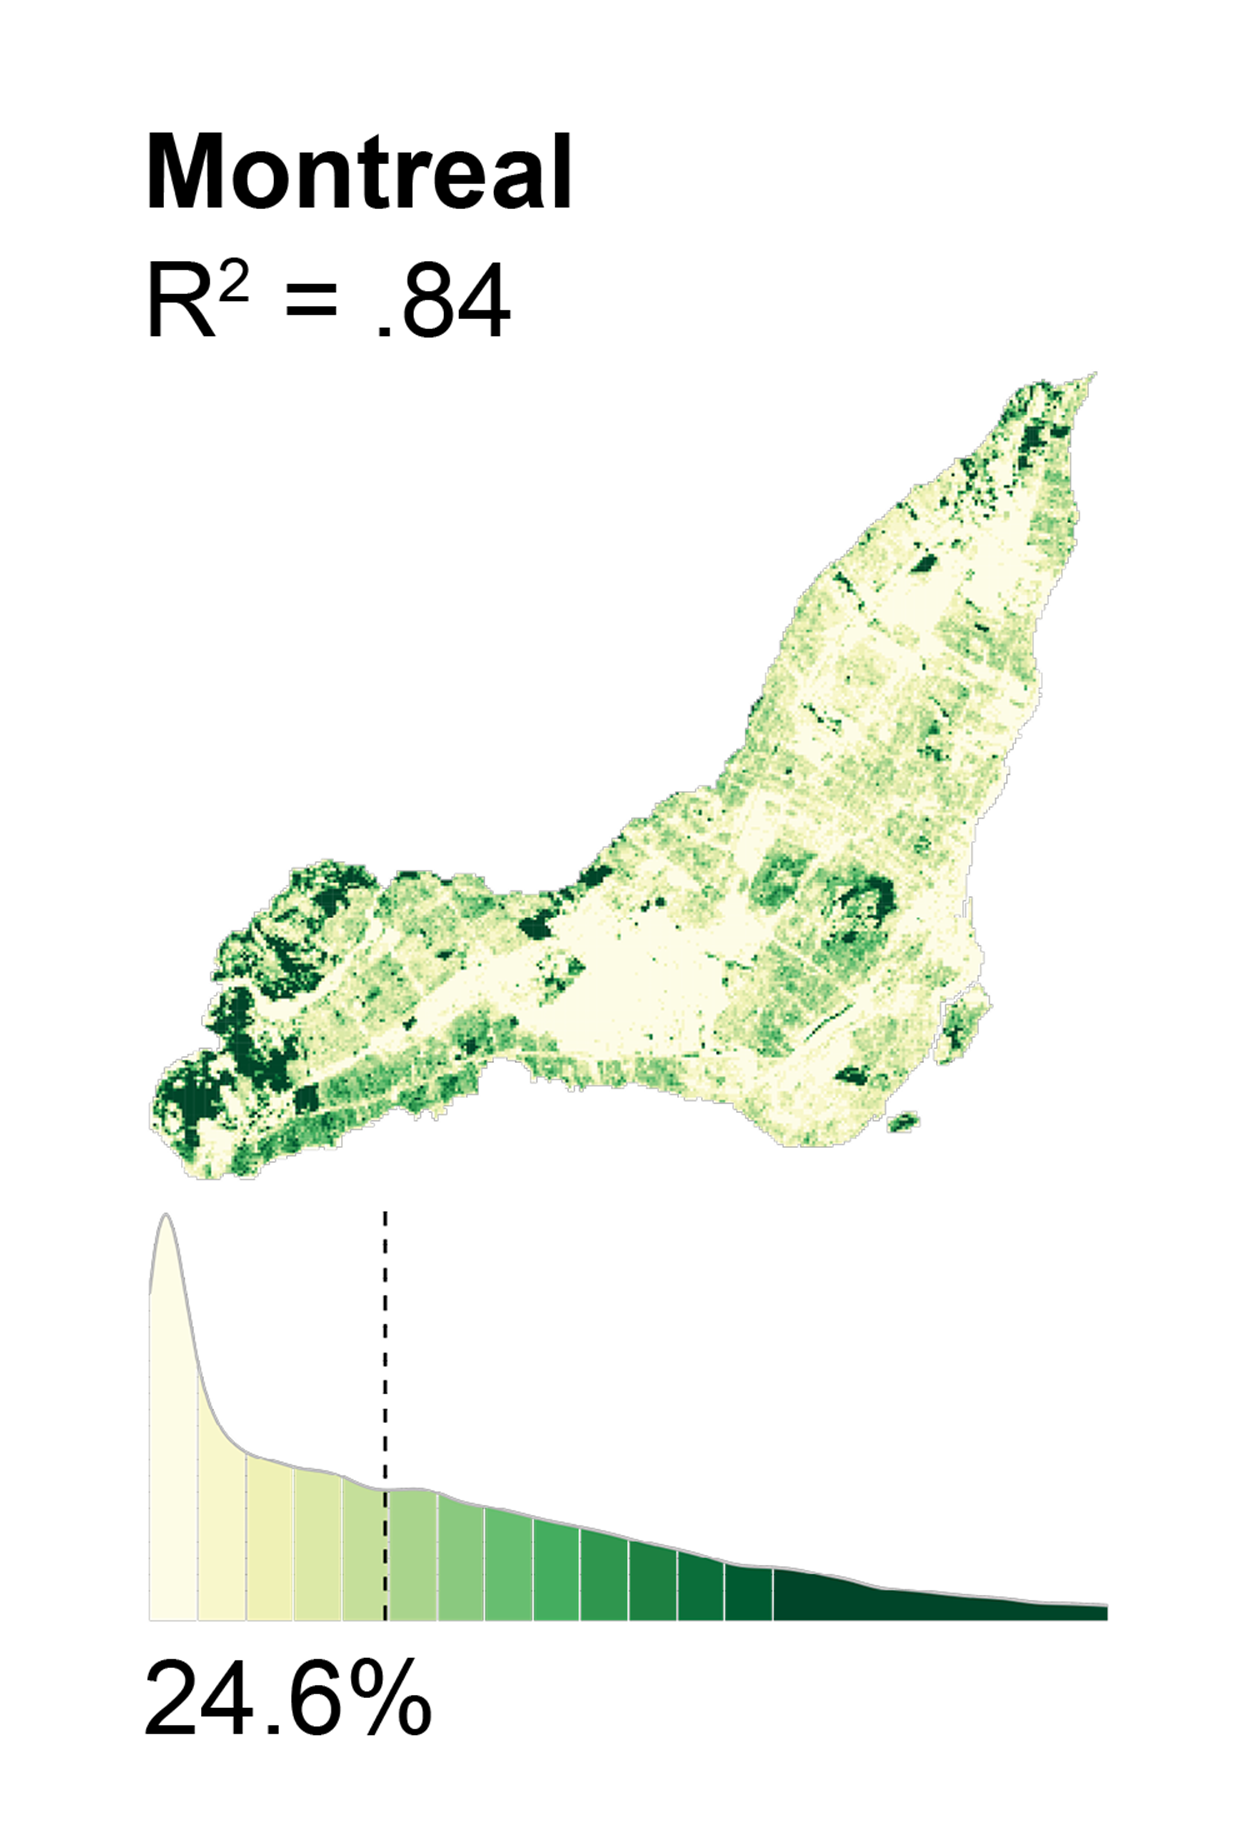
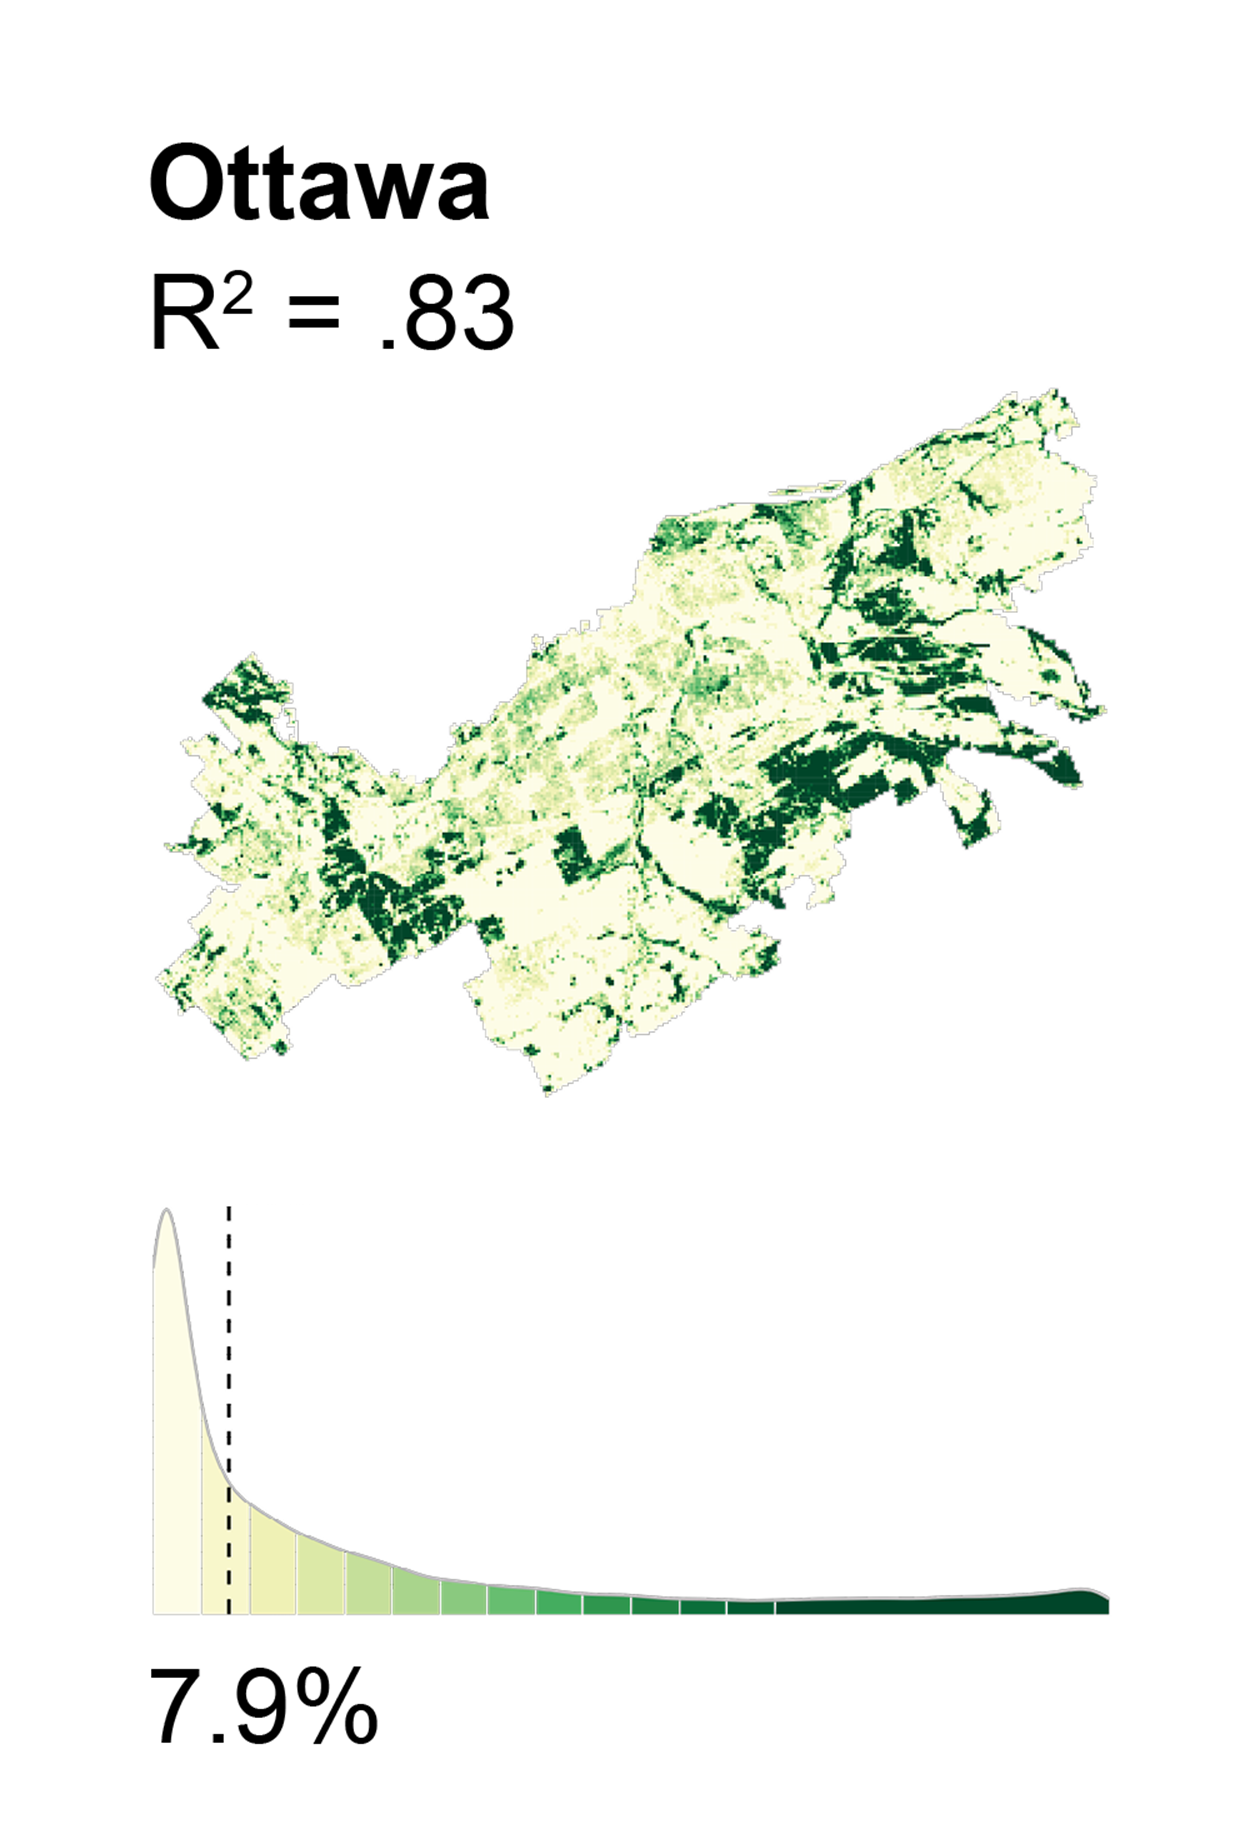
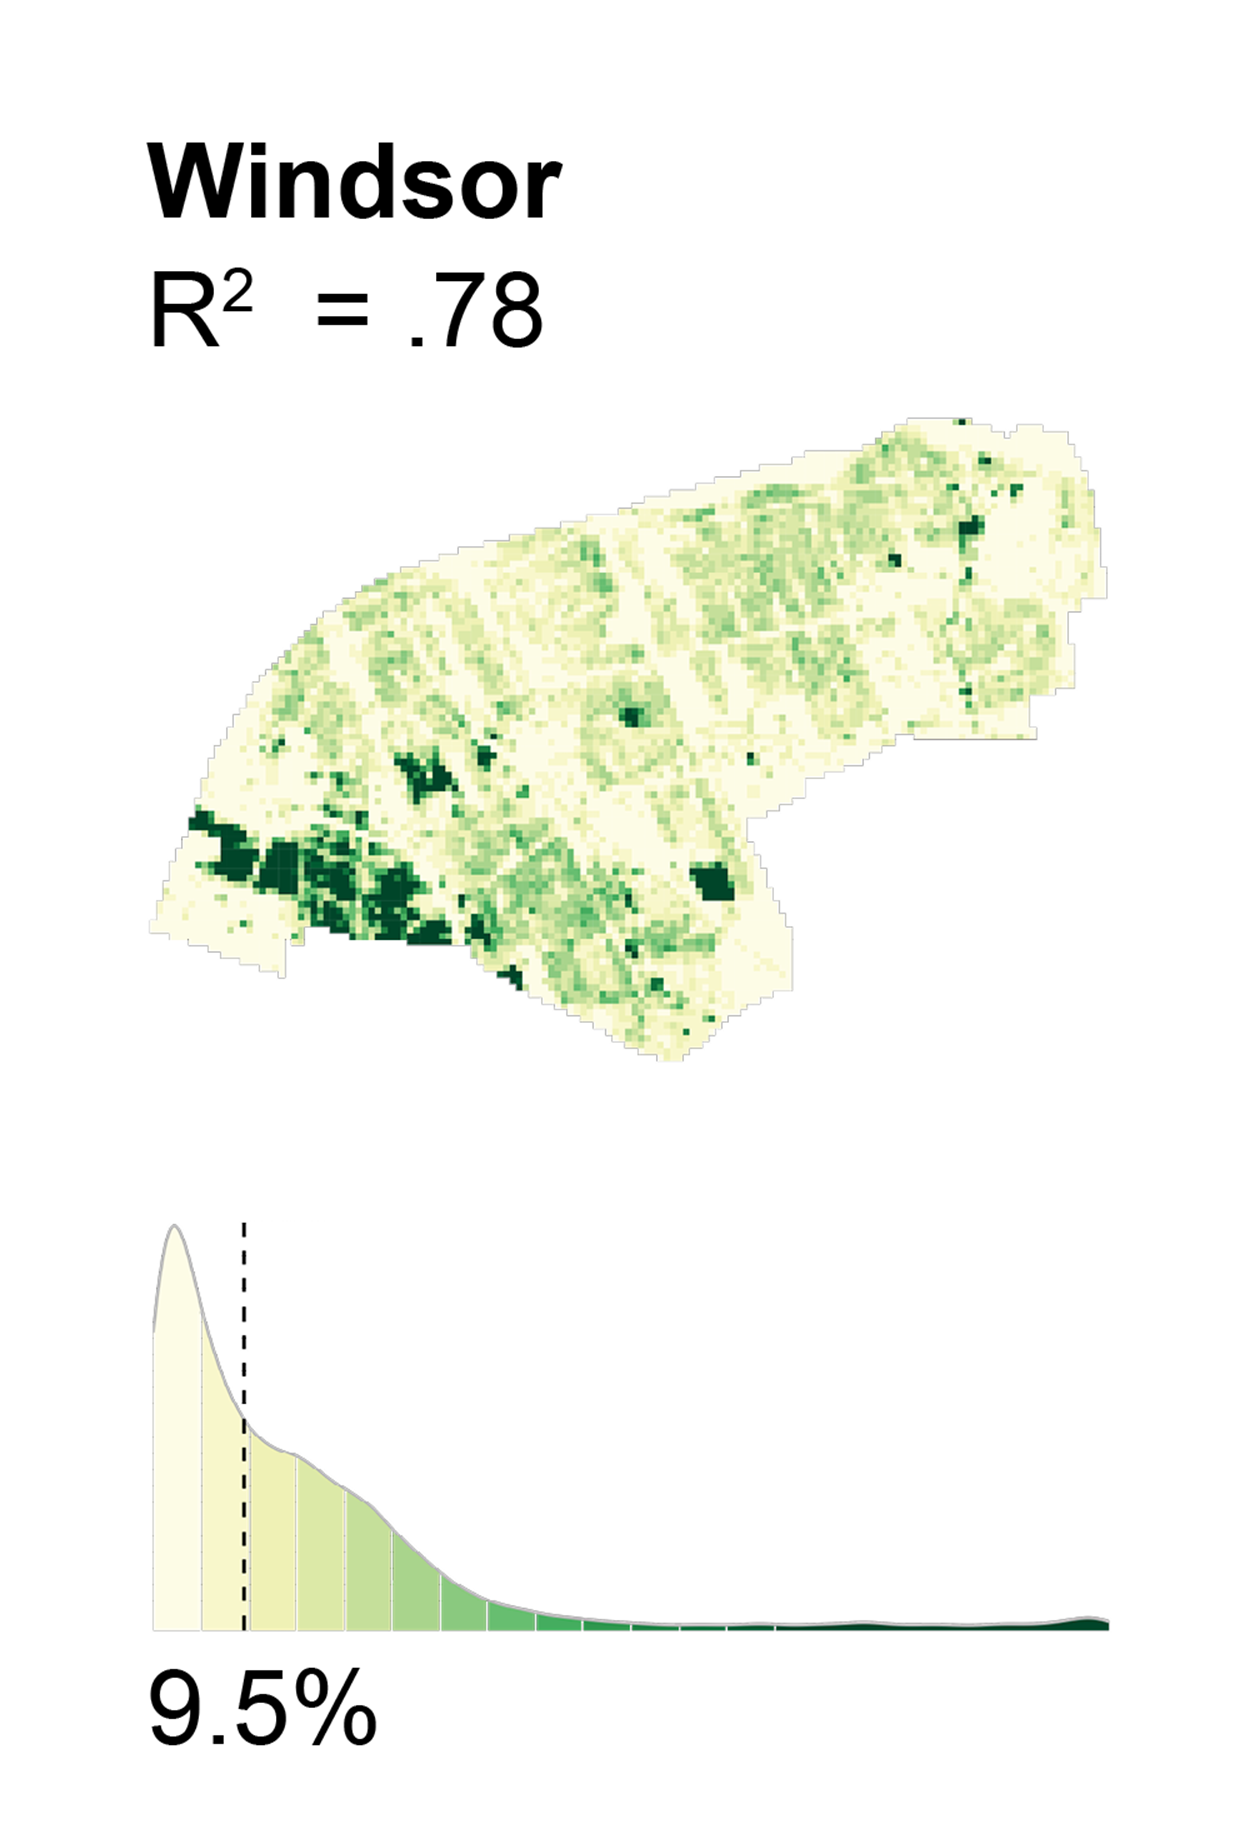
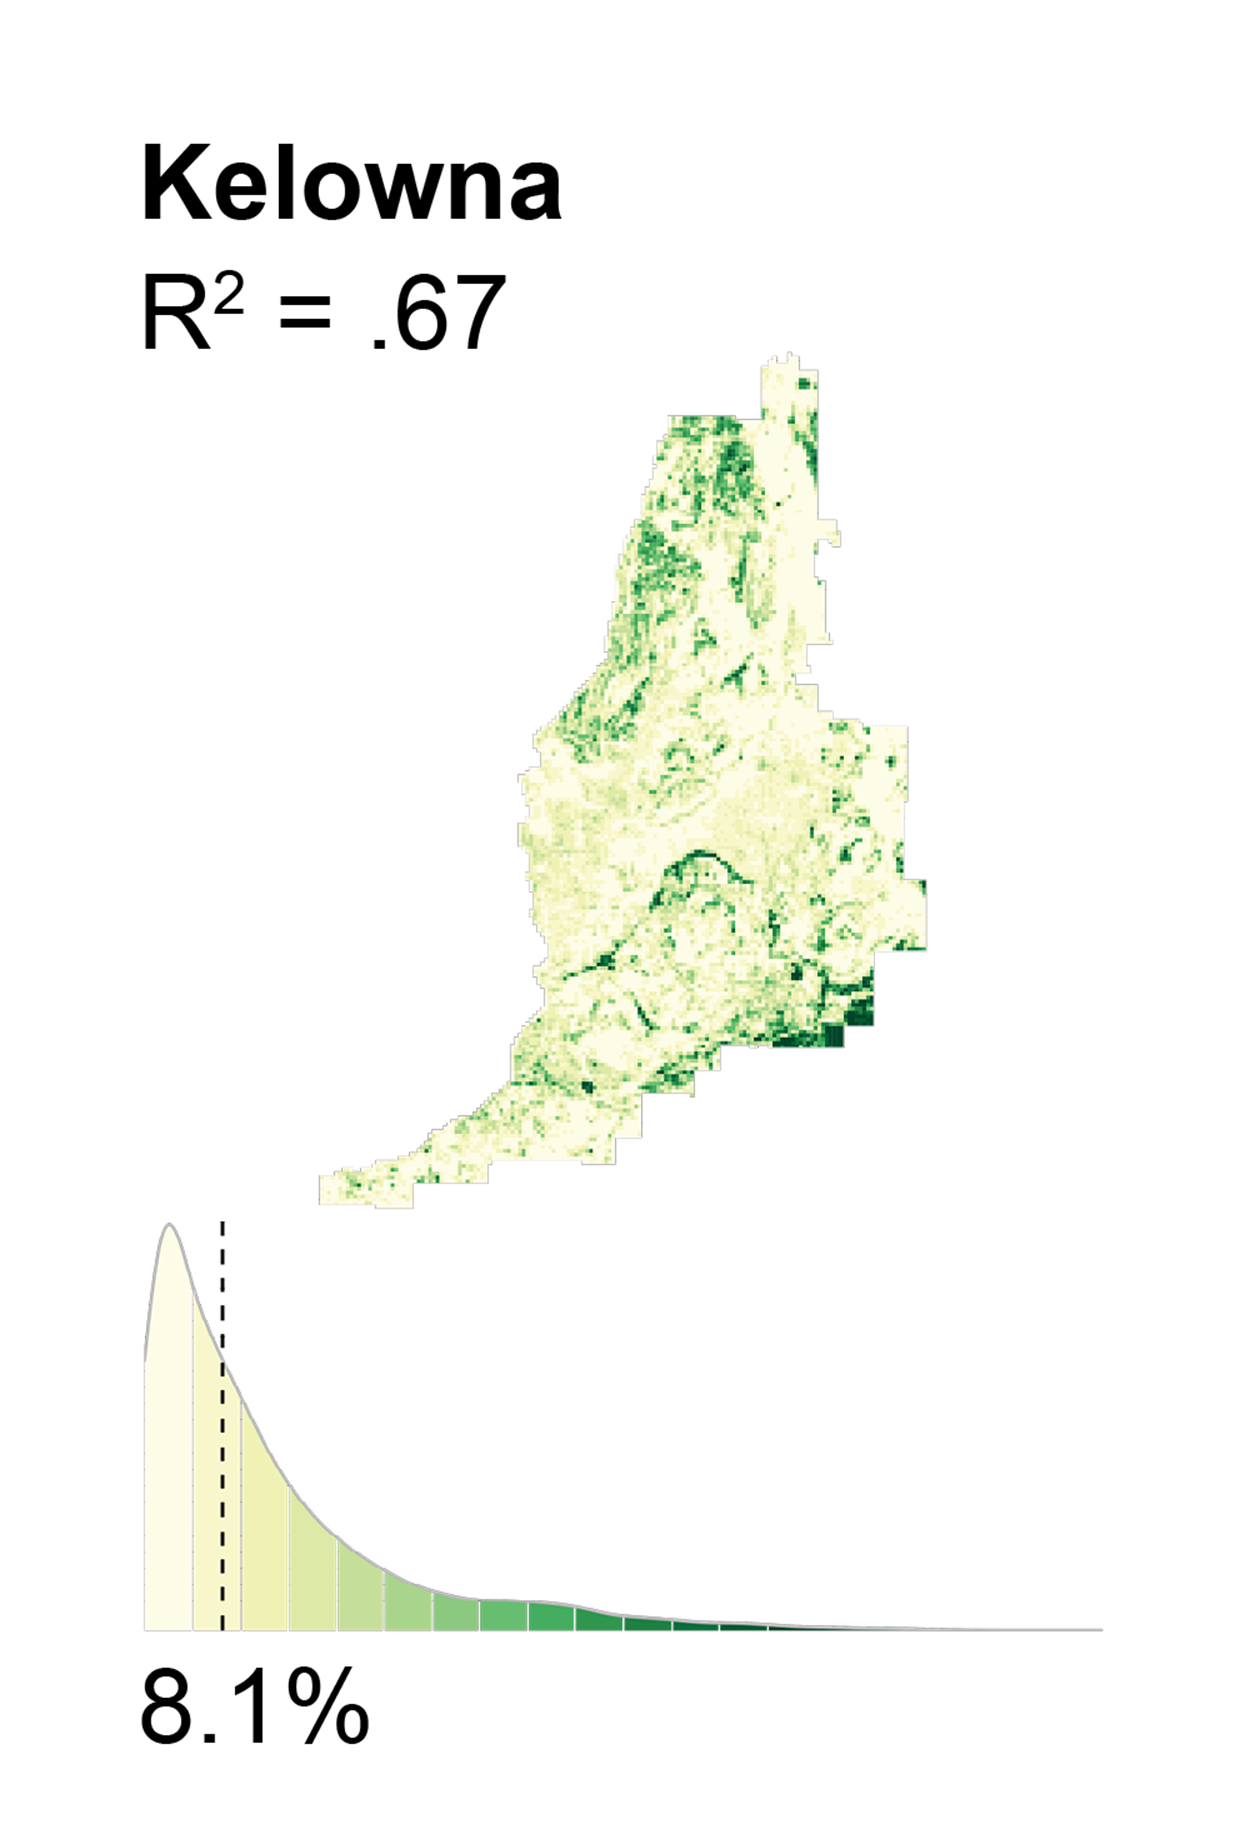
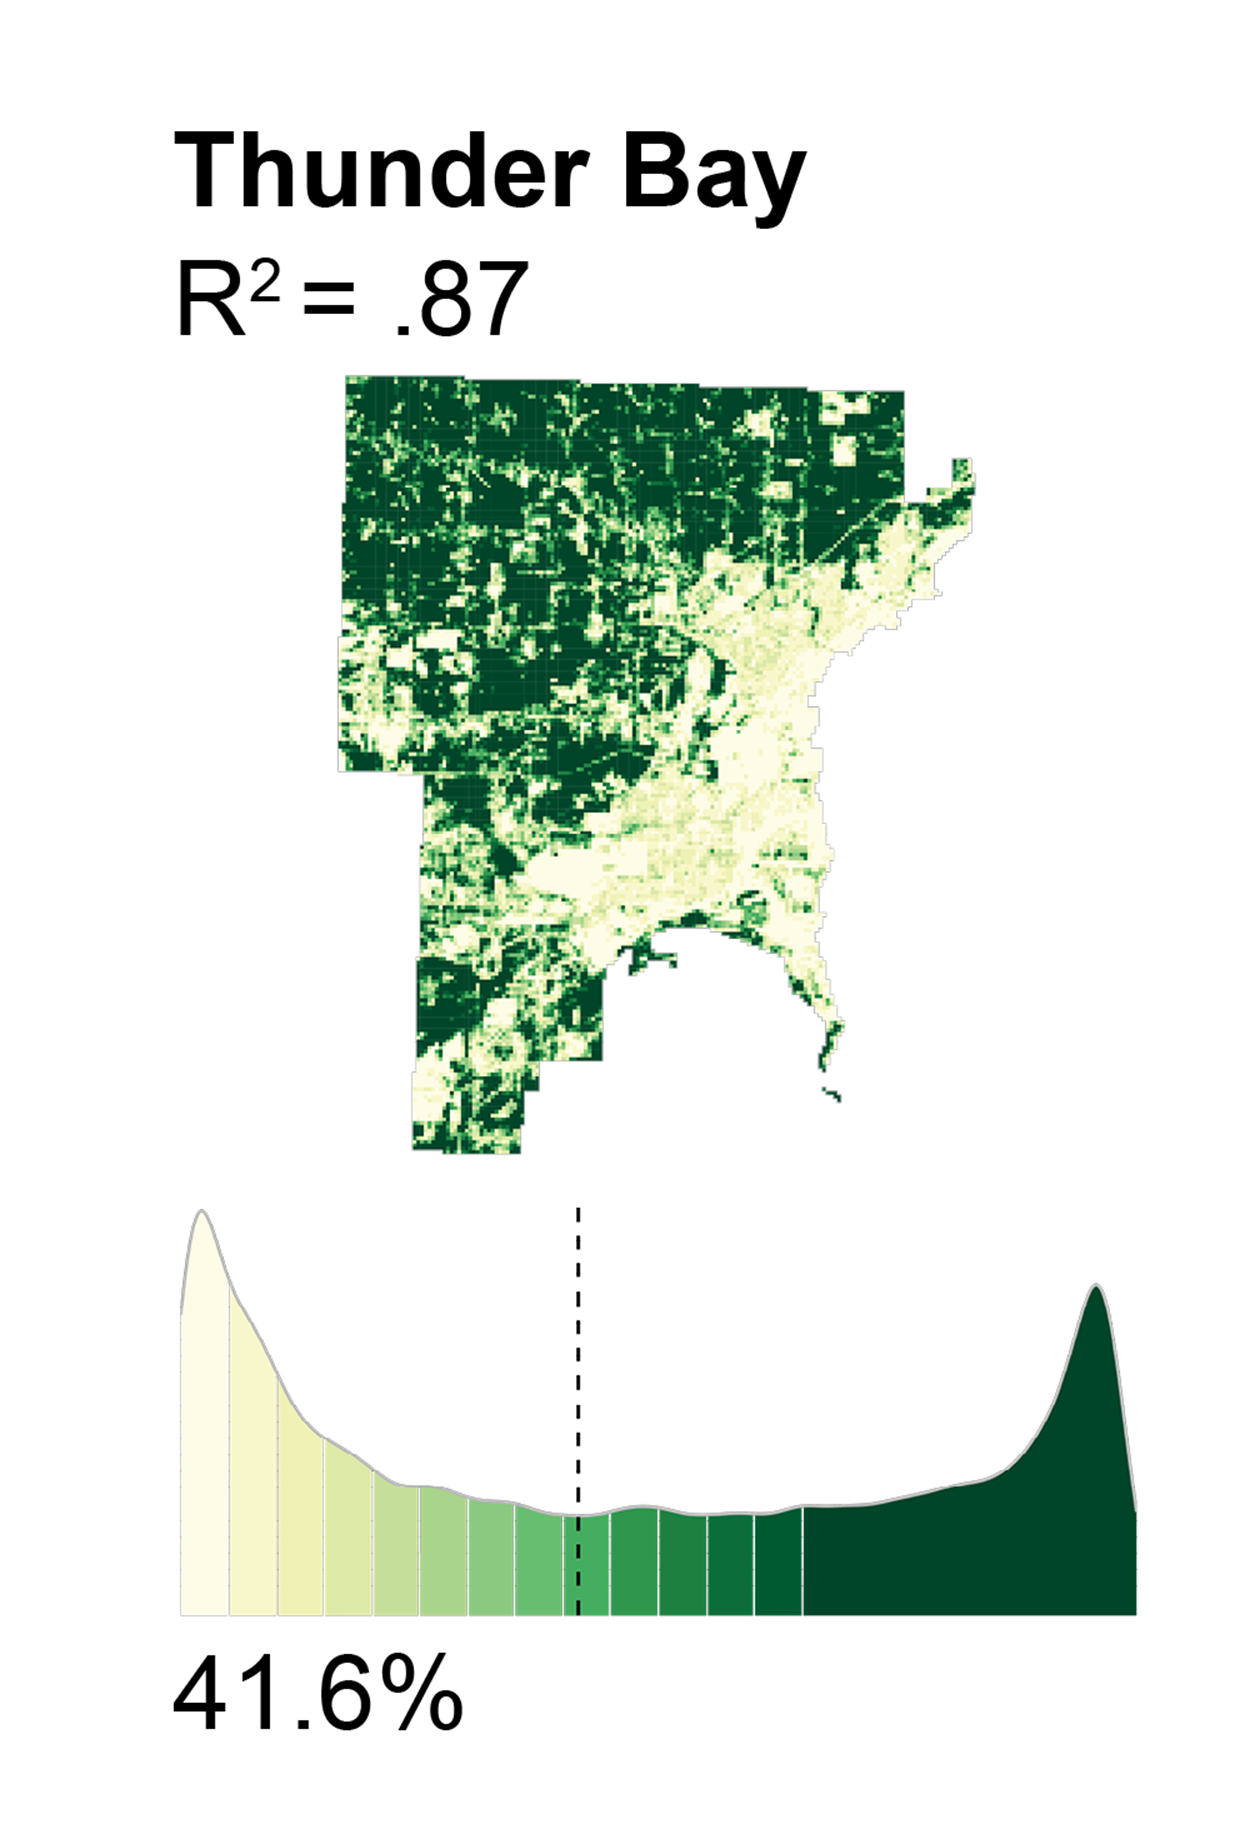
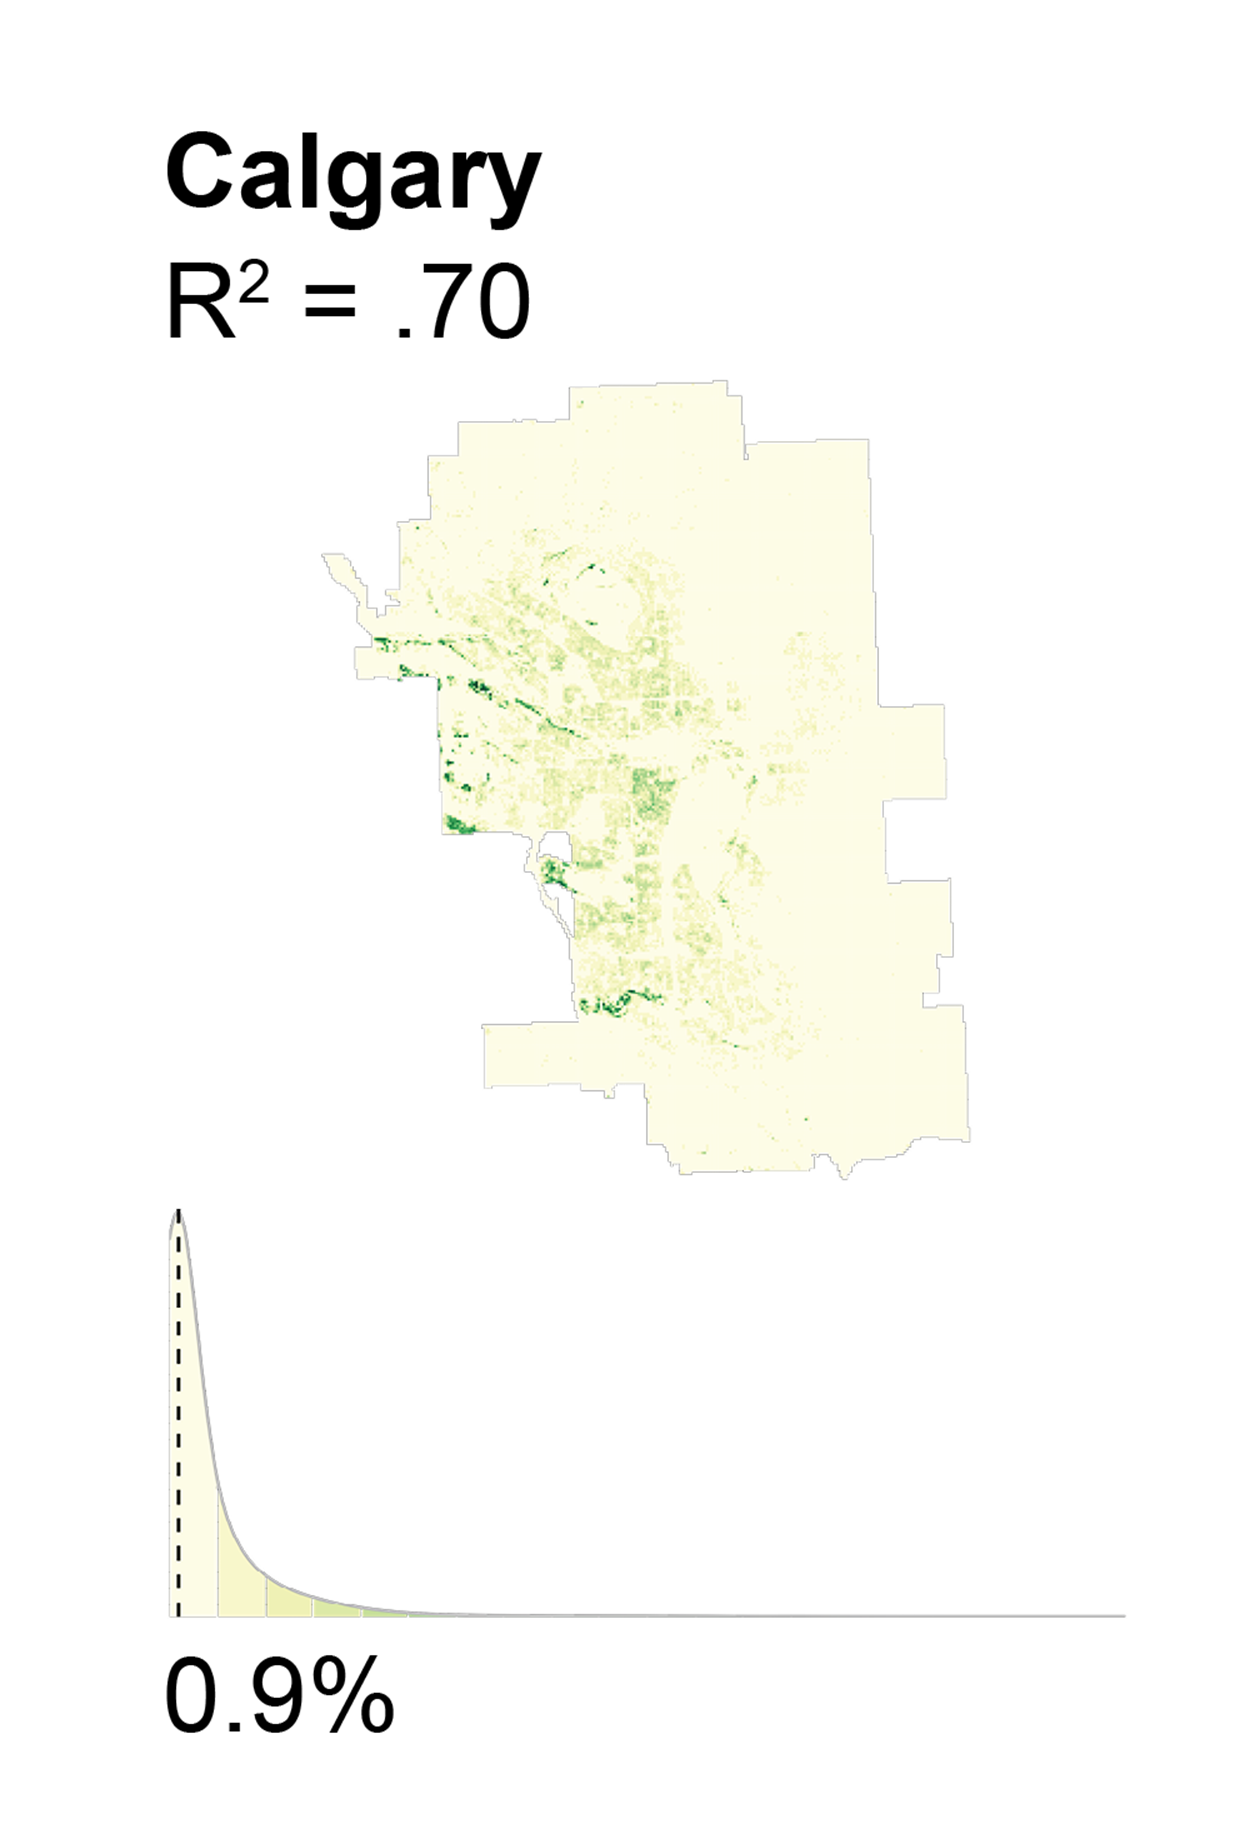
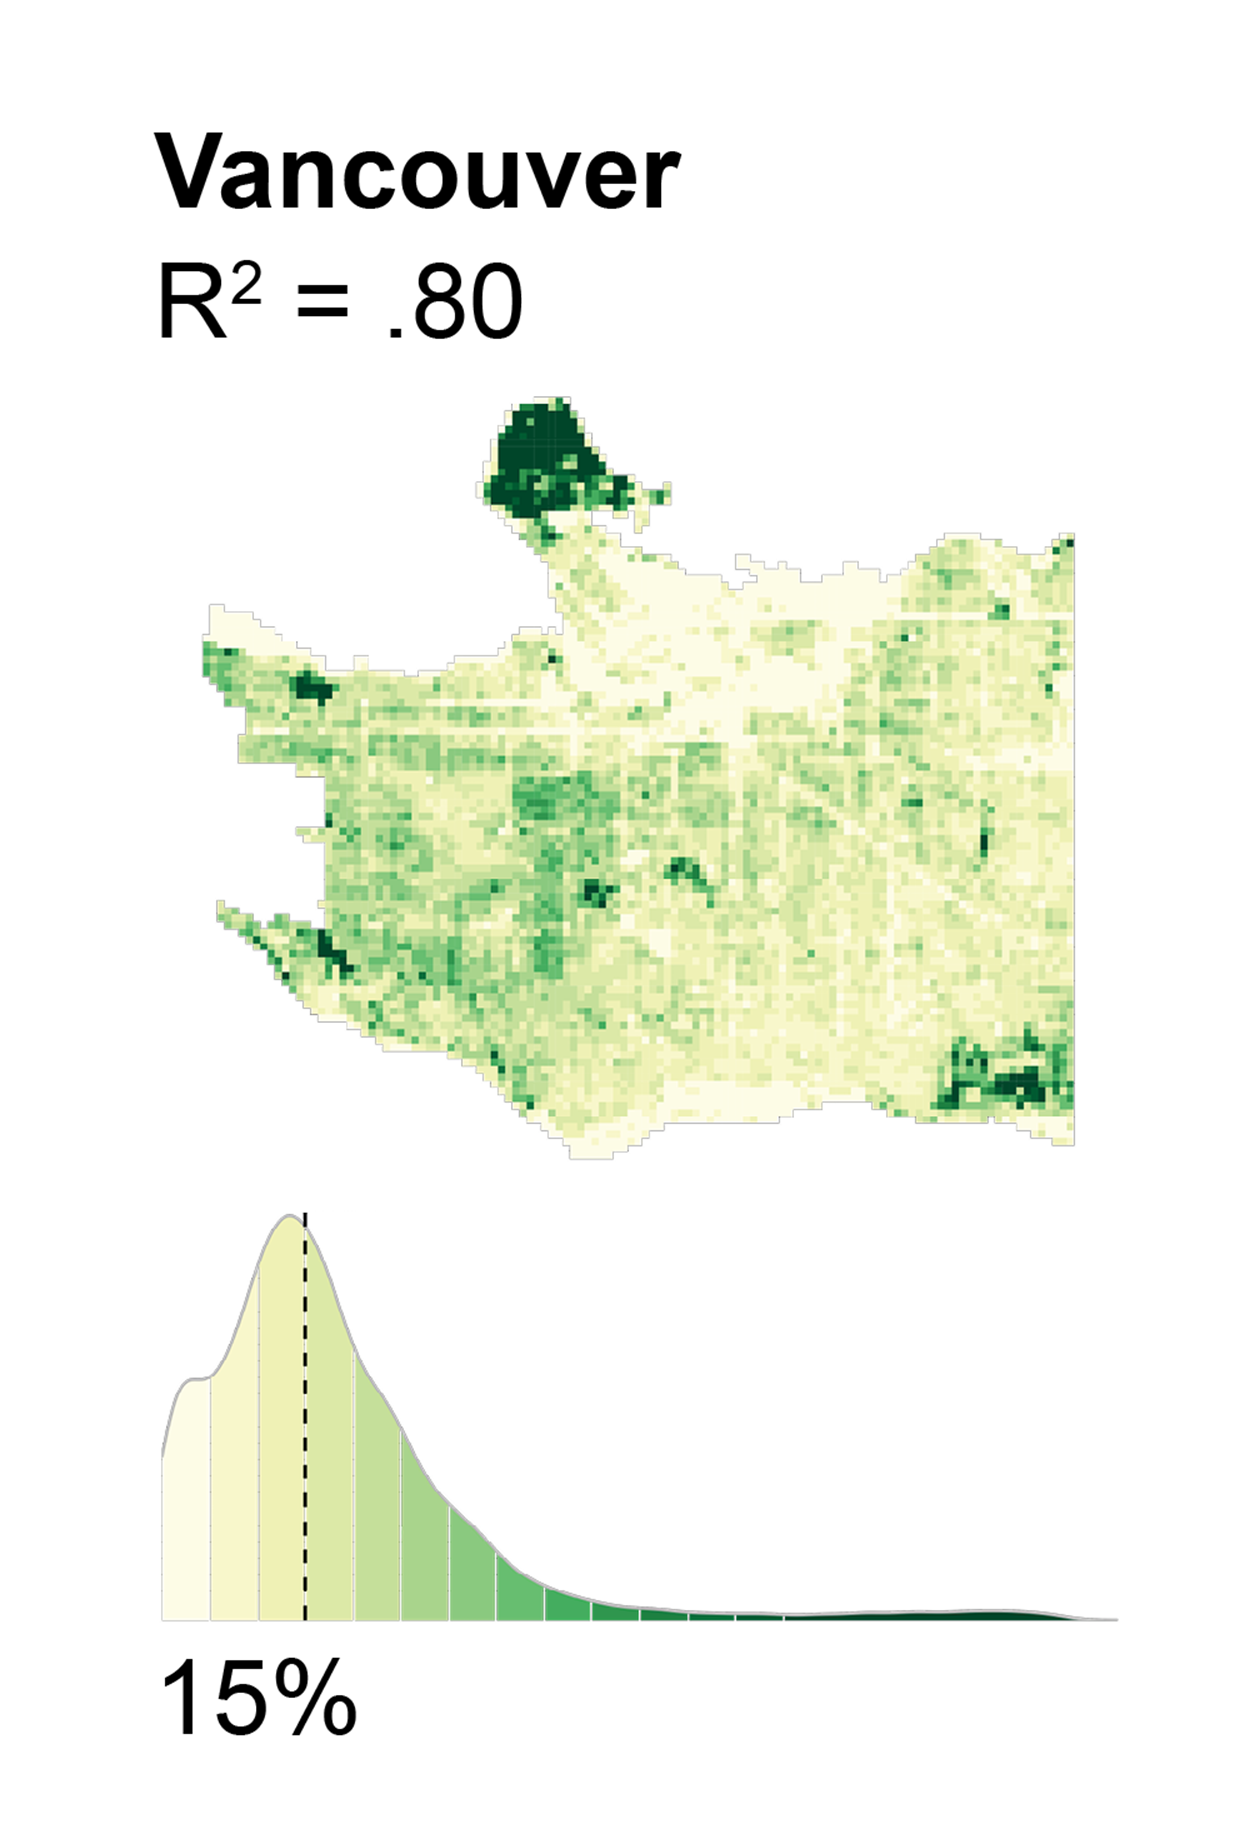
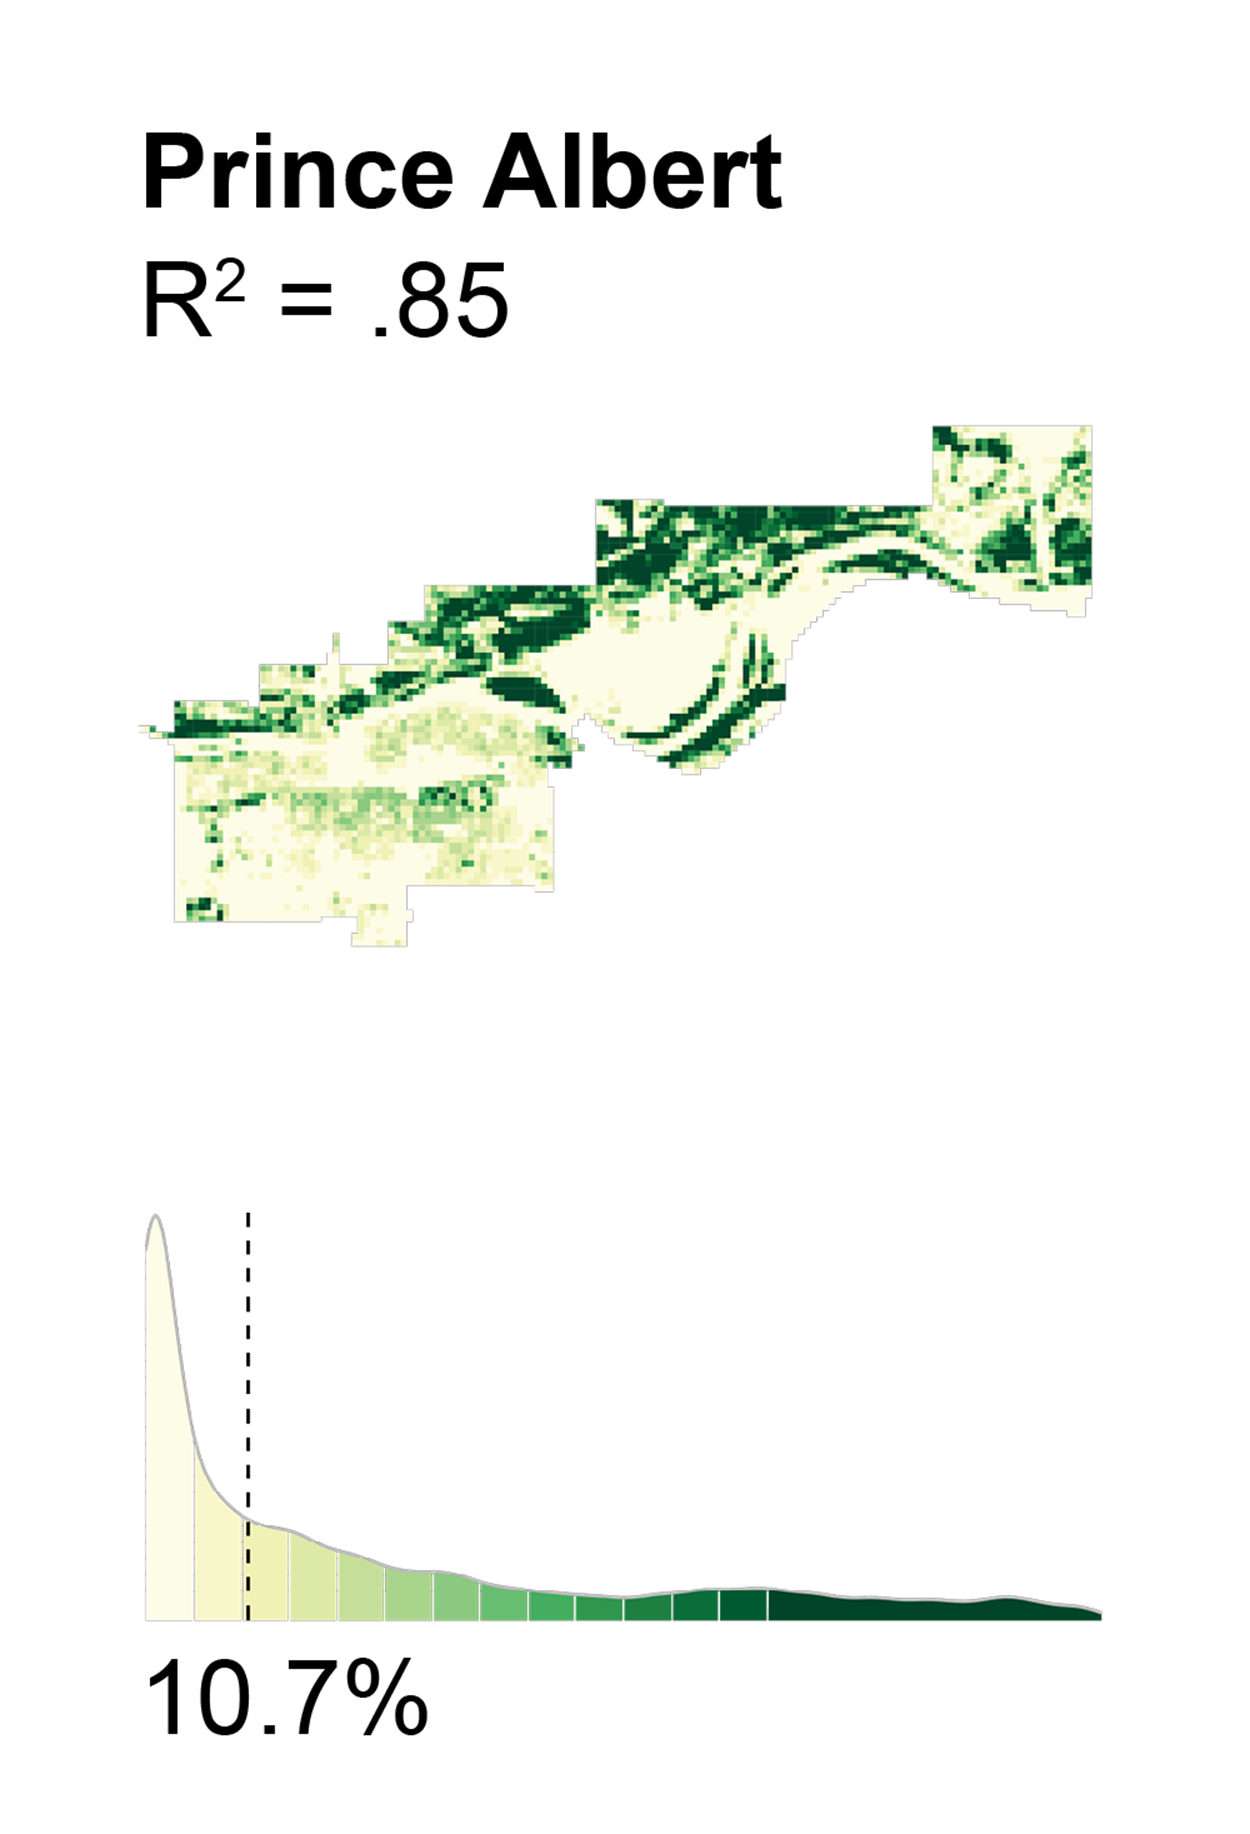
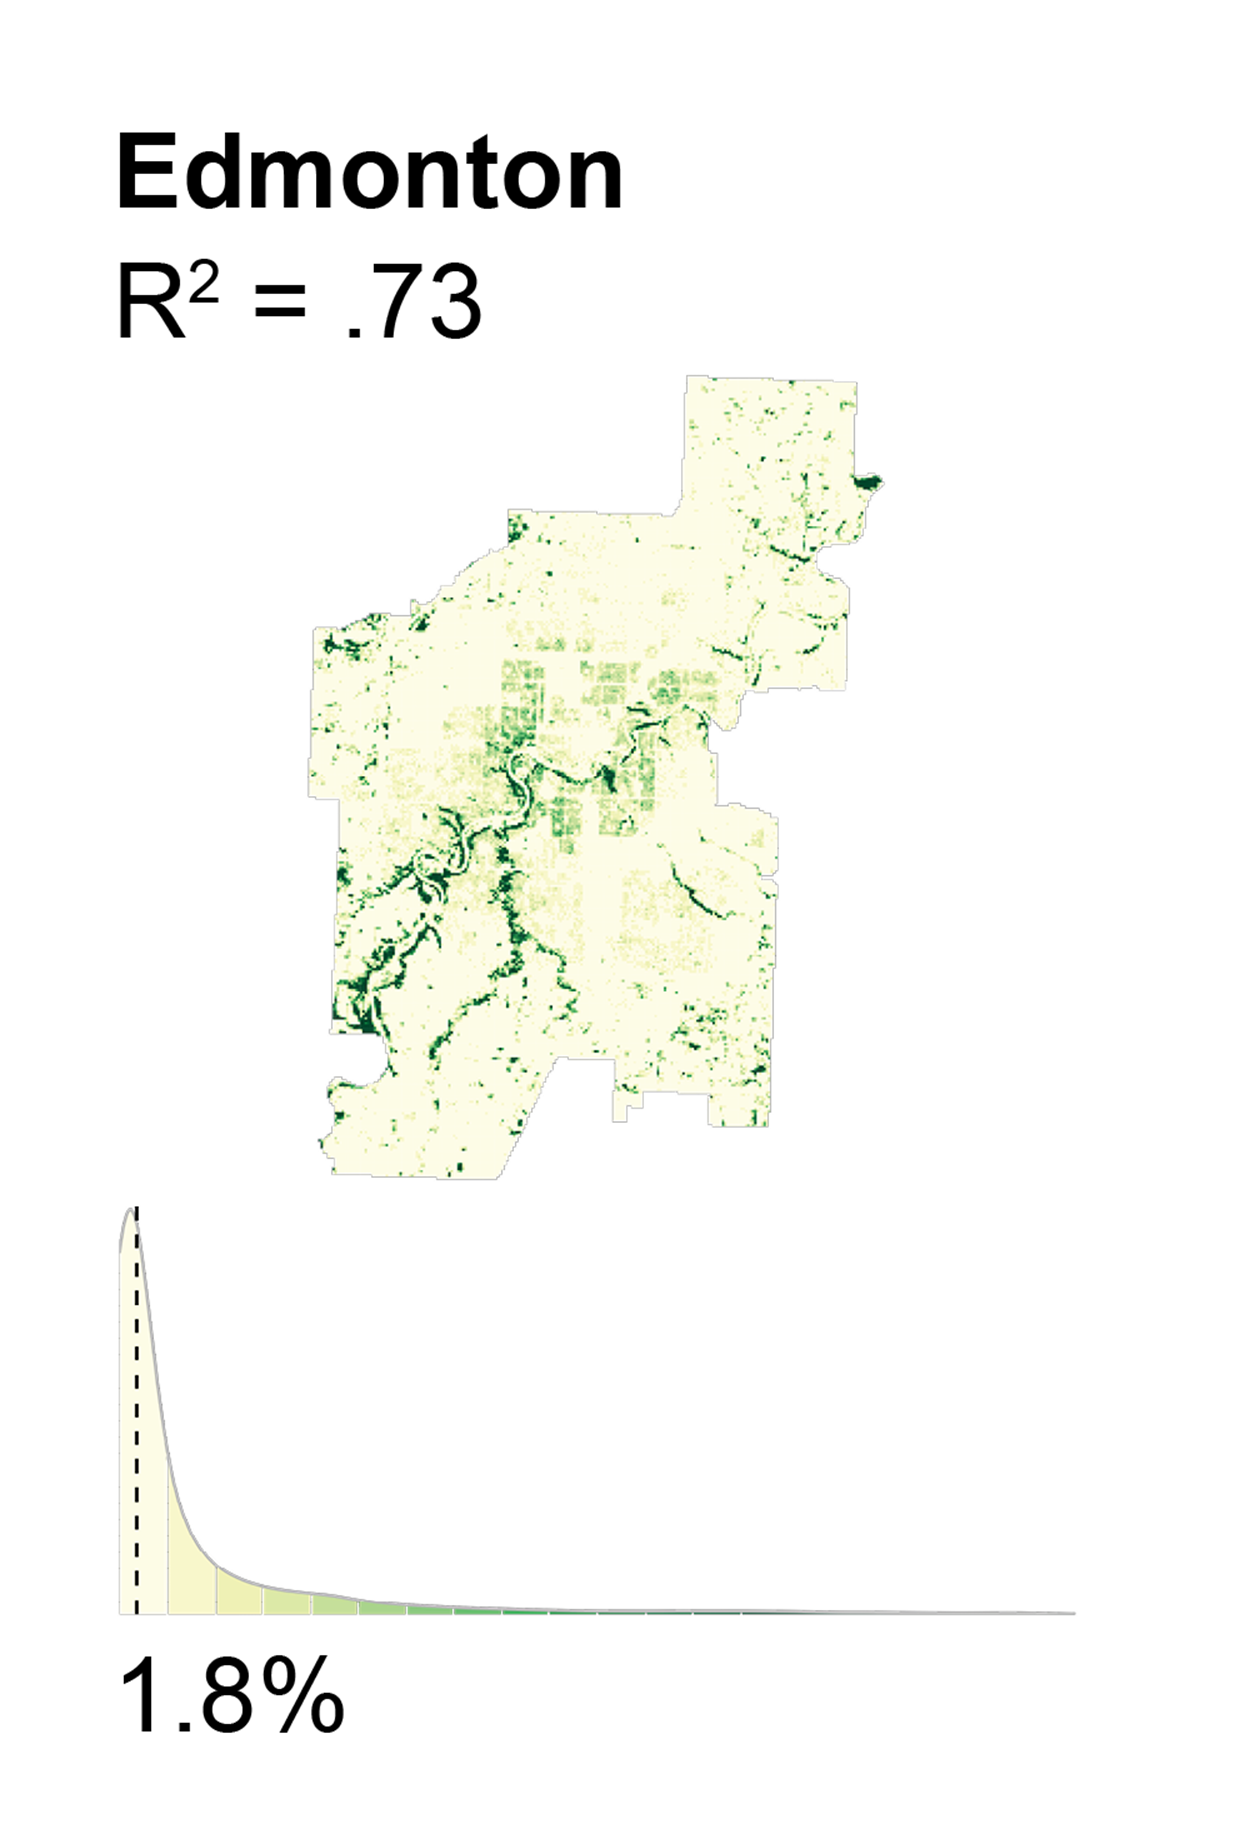
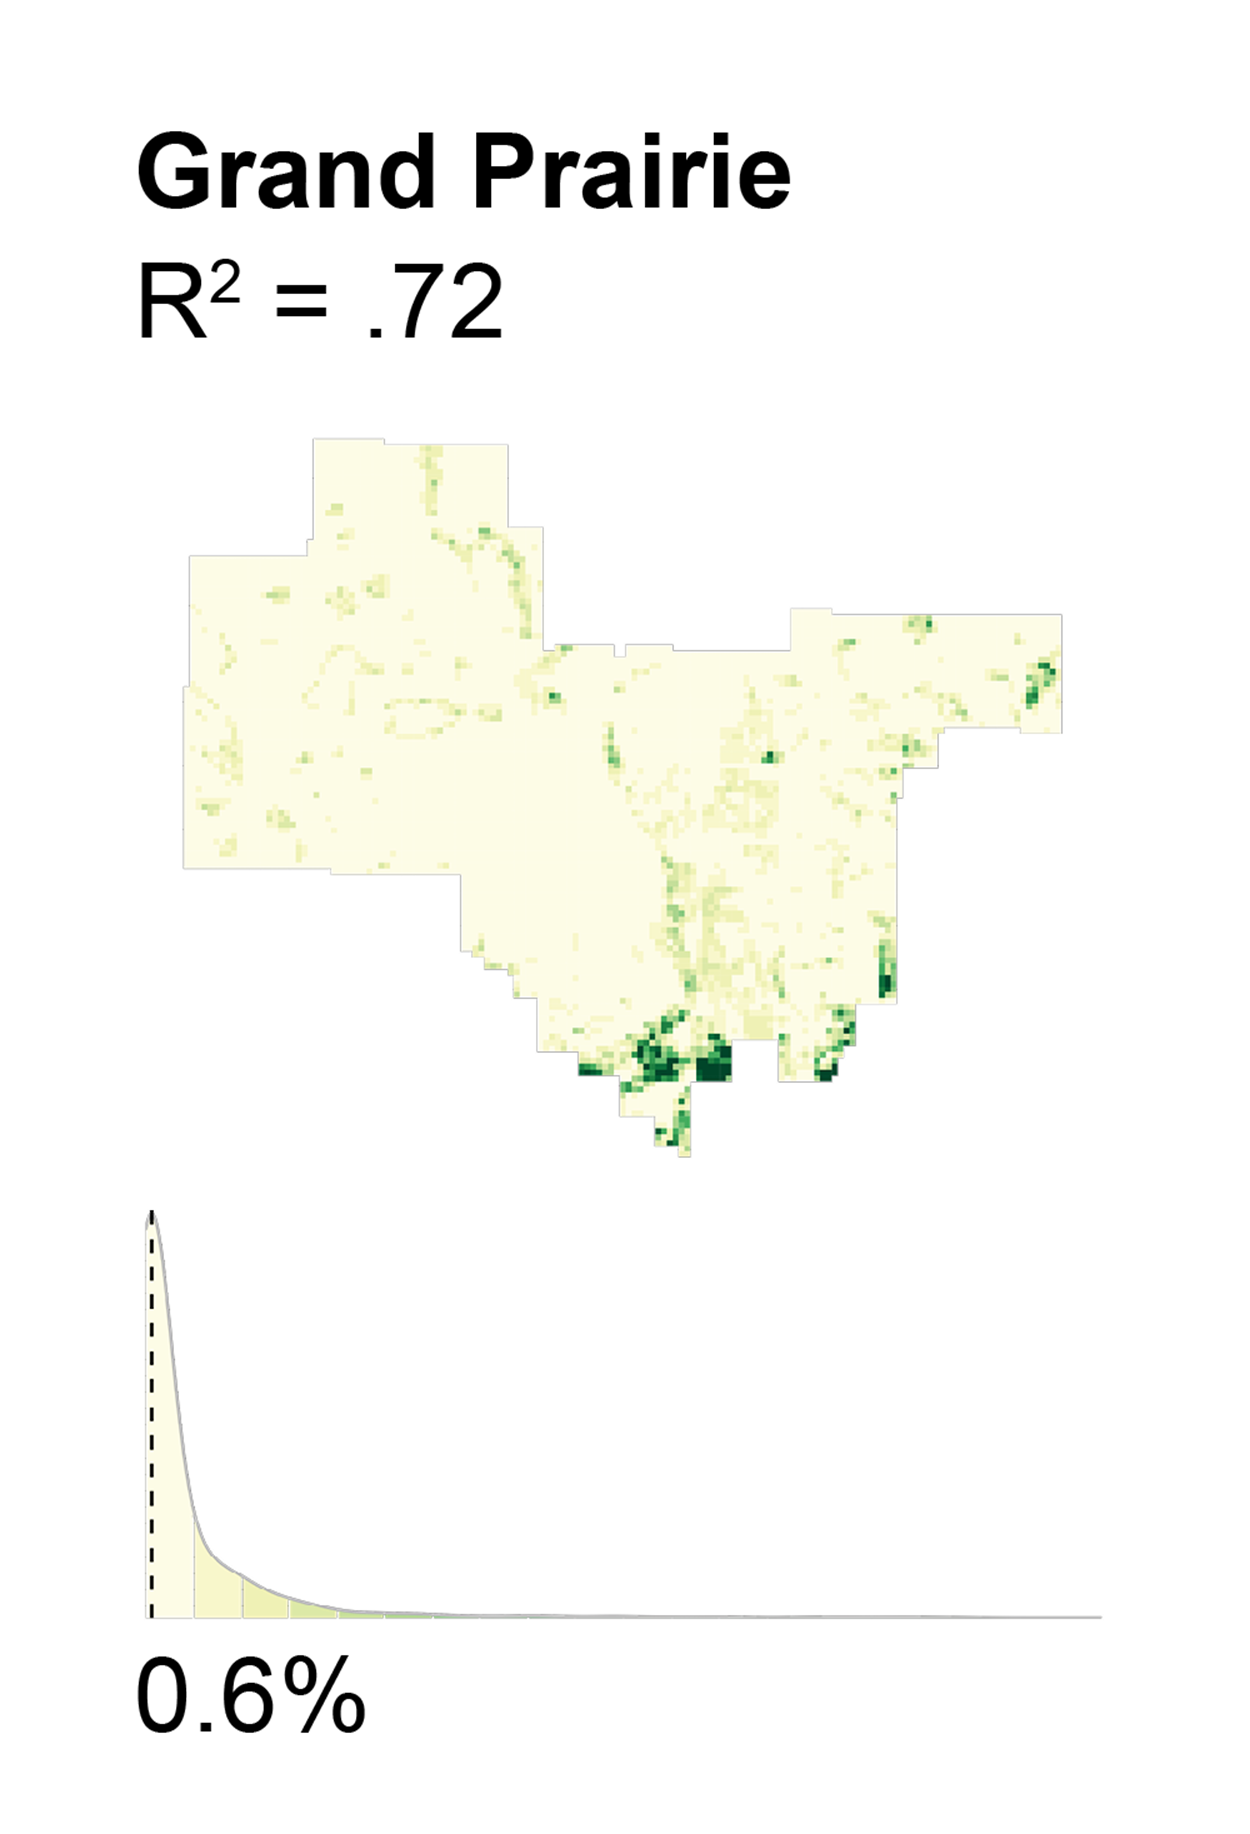
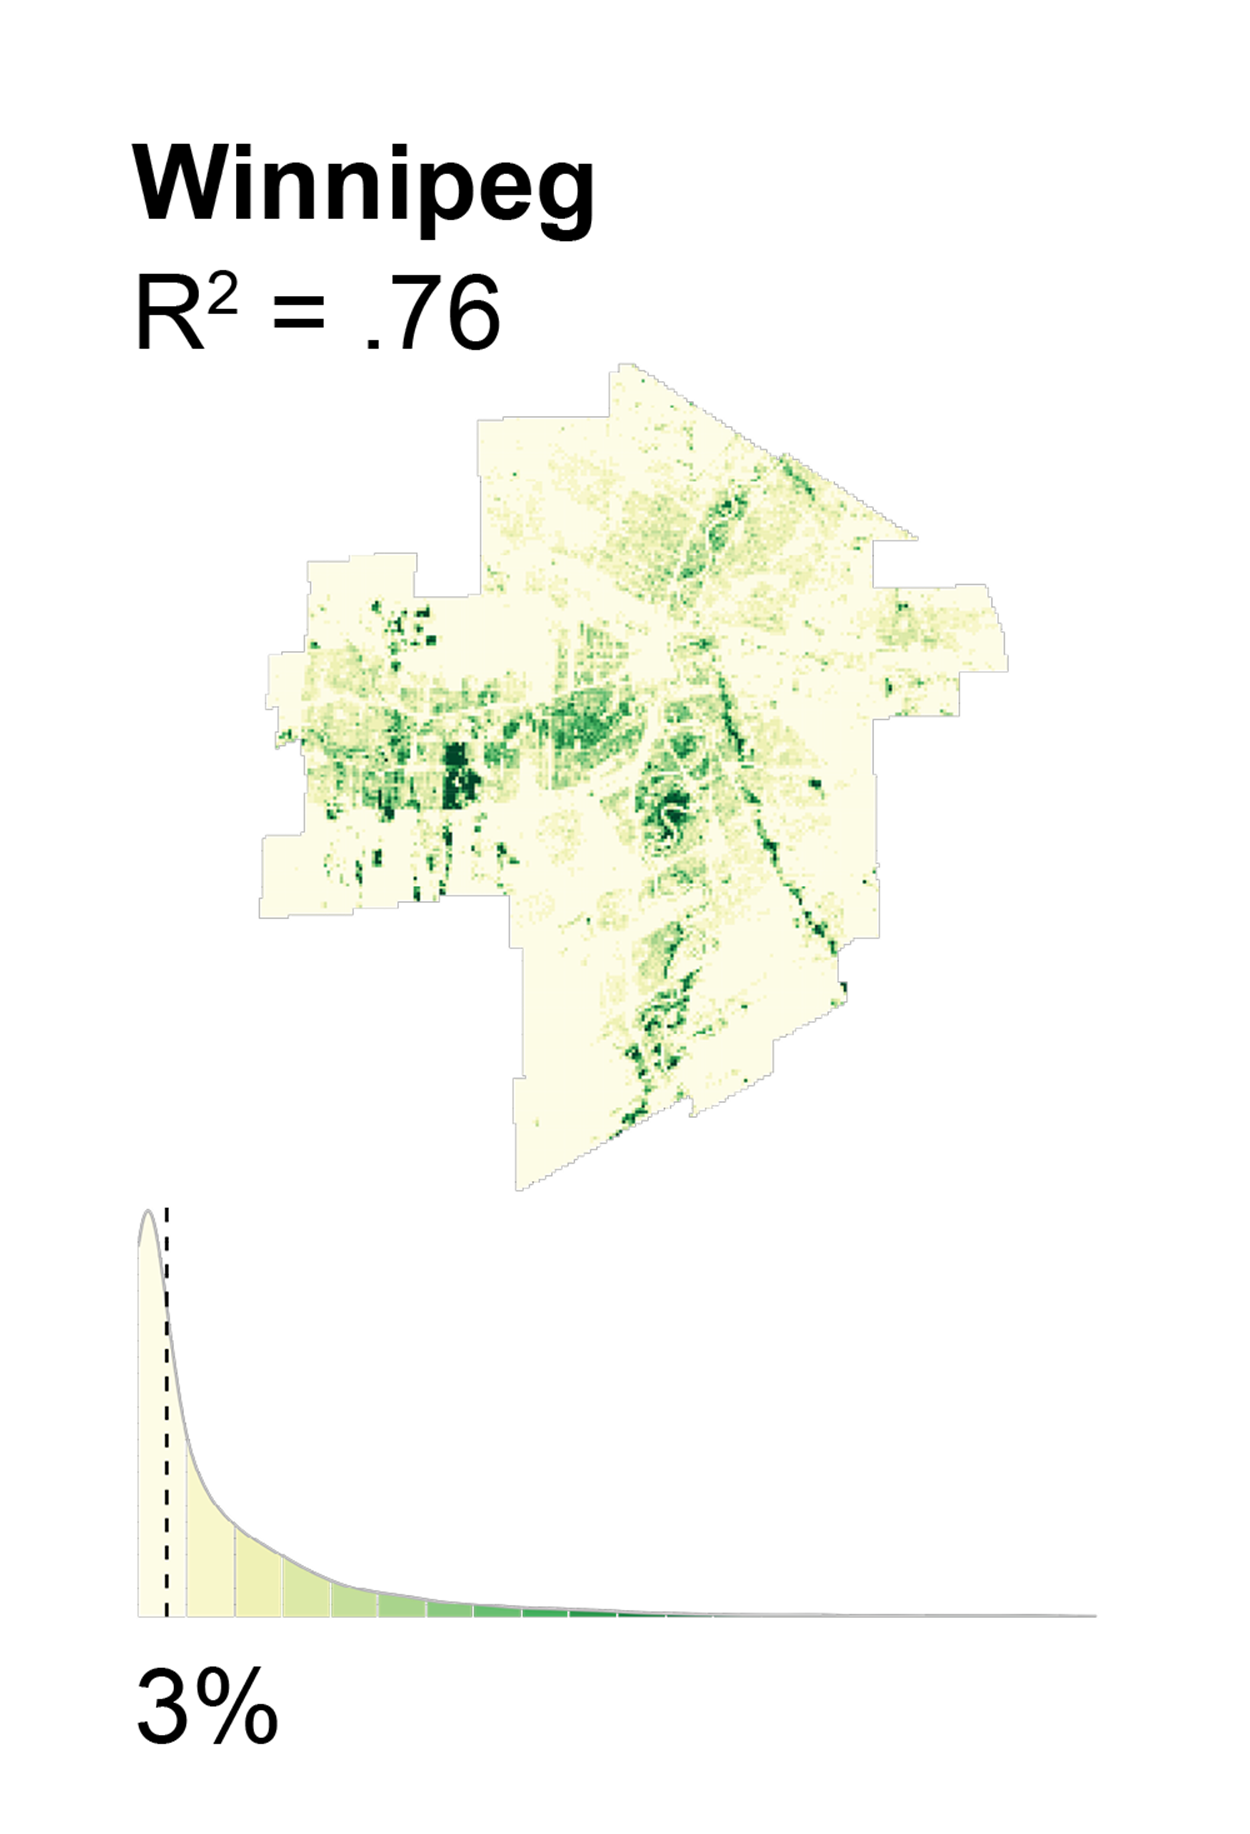
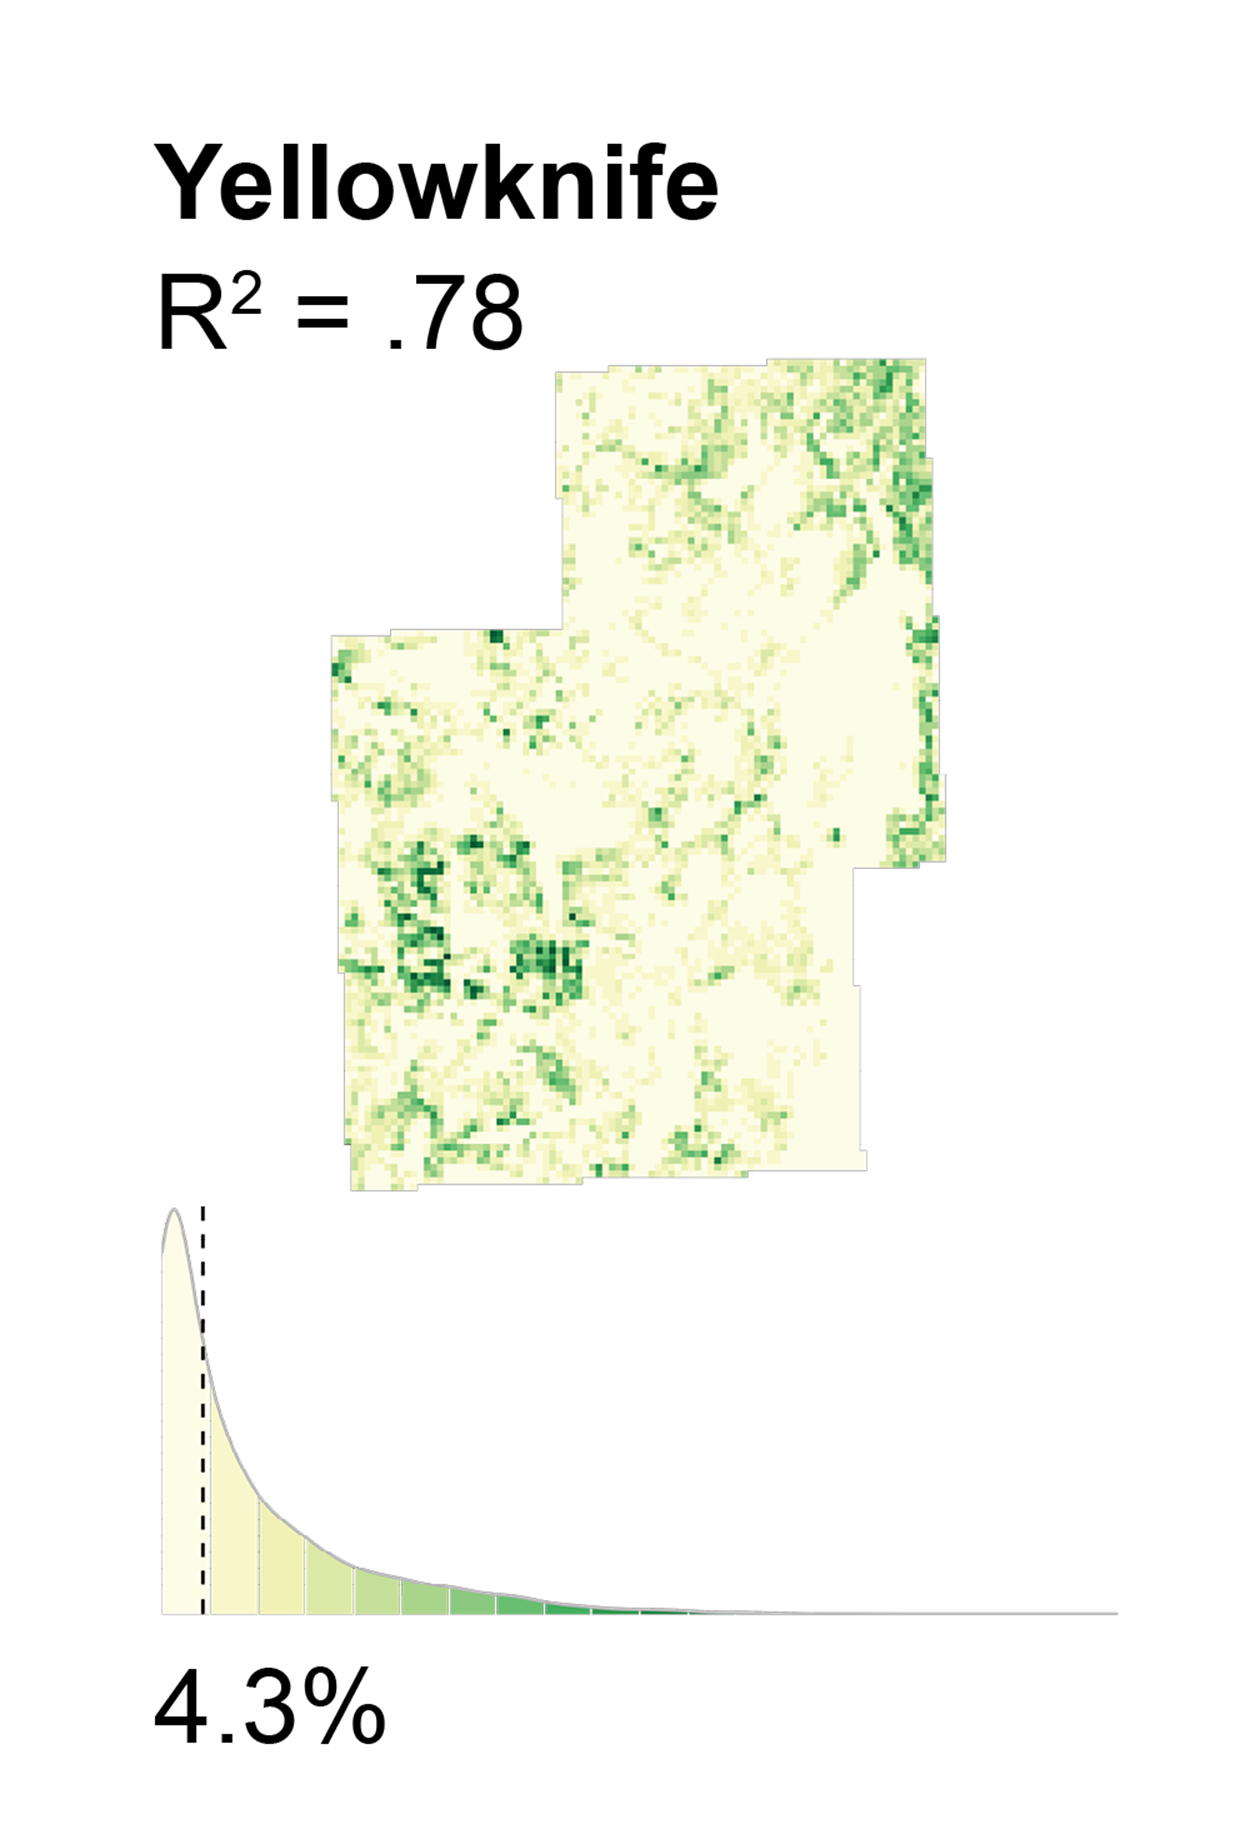
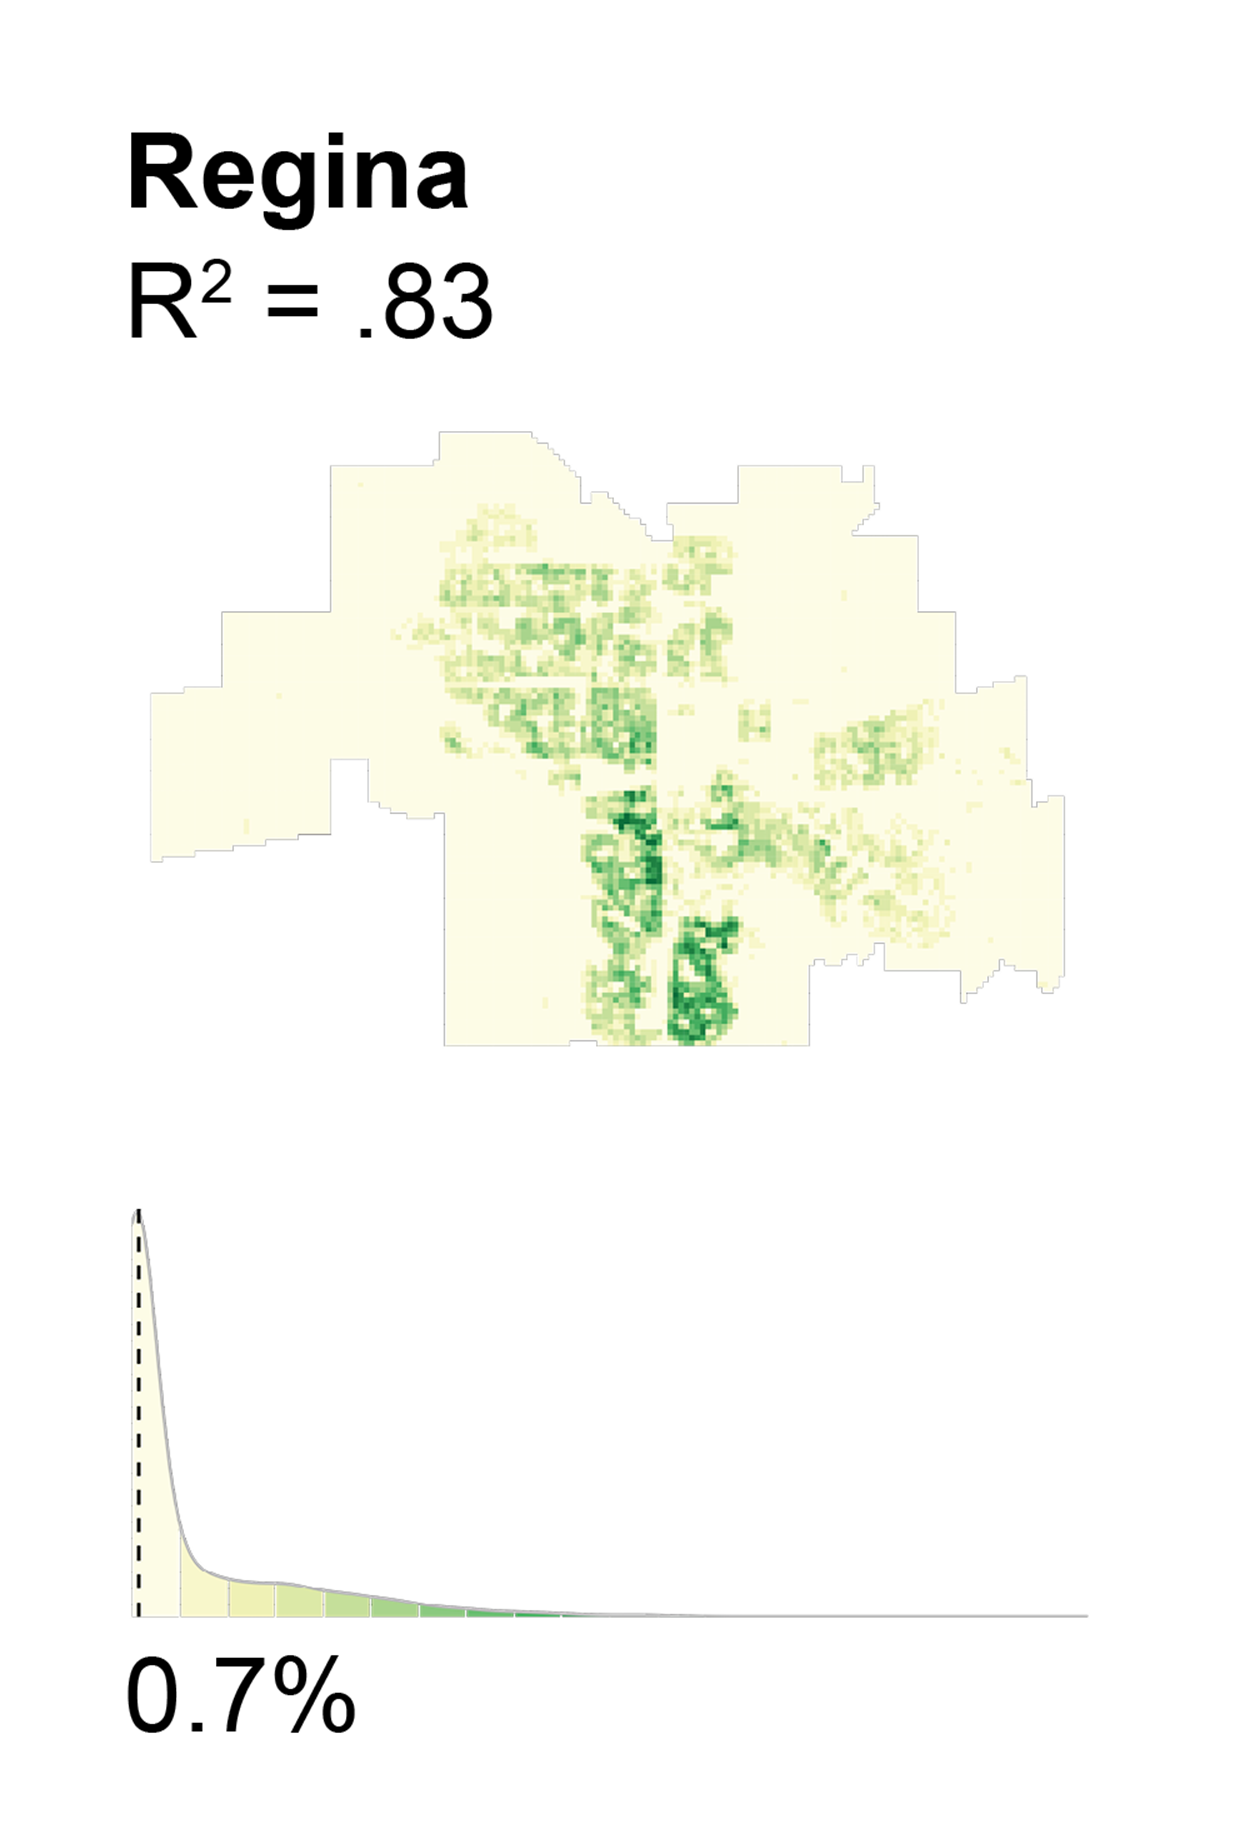
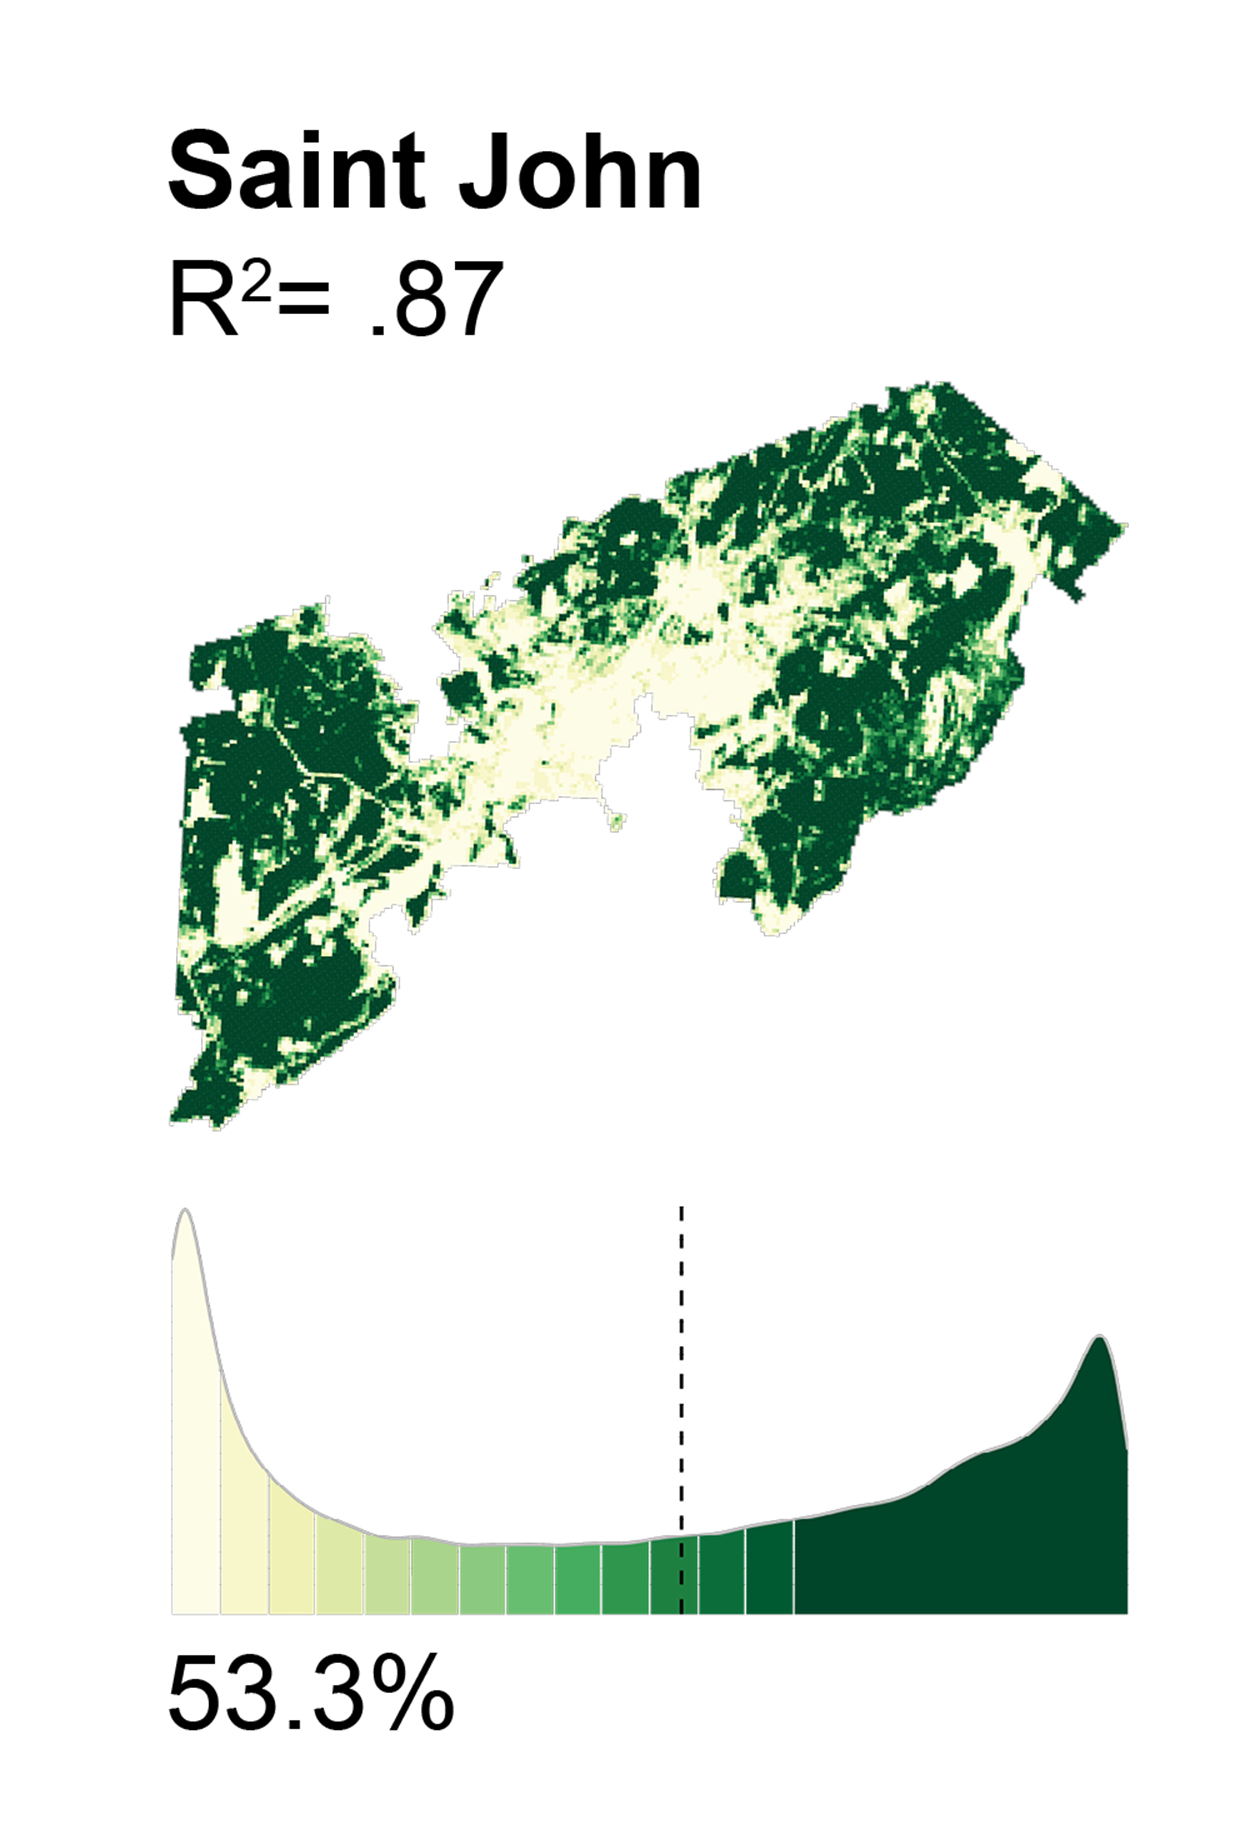
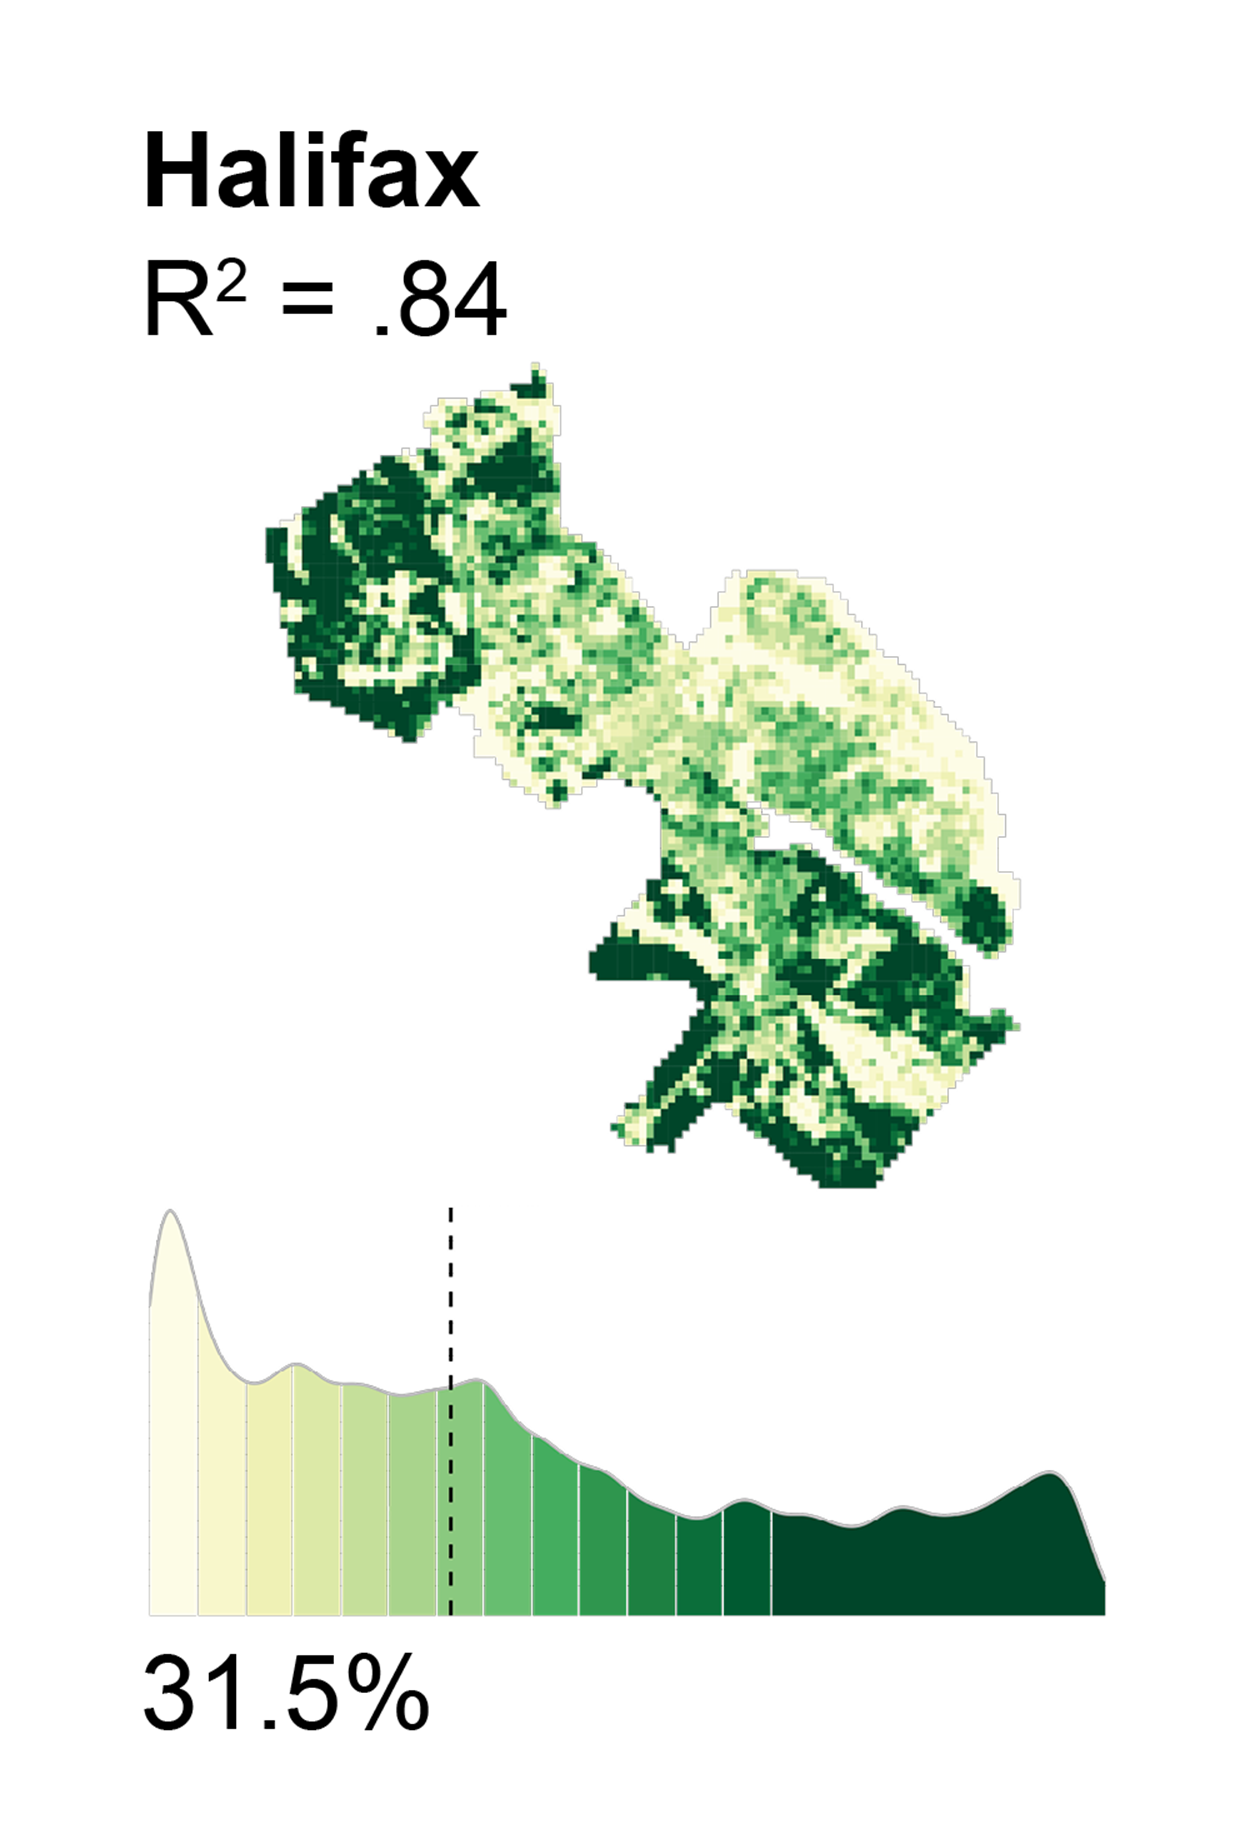
Across the 19 cities, the UTC estimation reveals city-specific spatial distribution of urban trees. Cities with expansive park systems or forest reserves exhibit higher proportion of UTC over 65%, whereas those dominated by cropland display a substantially lower average city-wide UTC value. This is also evident in the statistical distribution of UTC values: most histograms 4 are strongly skewed: most grids have little, or no canopy and a smaller share of grids account for high UTC values (> 65%), which results the relatively low medians found in several cities such as Calgary, Regina, and Grand Prairie. These signatures point to strong intra-urban heterogeneity even where overall citywide canopy is modest.
Acknowledgement
We thank the University of Manitoba’s URGP and URA for supporting funding for this research. We also thank the University of Manitoba Grex High Performance Computing Centre (RRID: SCR_026342) for providing computing support and cloud storage. Additionally, we thank Dr. Nicholas Coops for his valuable comments on the early draft of this manuscript. Any use of trade, firm, or product names is for descriptive purposes only and does not imply endorsement by the U.S. Government.