

Hills or Not Hills
A COVID-19 quarantine weekend project.
Starting mid-April 2020, as the weather is getting warmer and the day is getting longer, I have noticed that many of my favorite running paths were becoming more and more crowded. Many runners and cyclists share a common list of routes around the city and that usually exclusively includes a few popular routes (e.g. seawall). With the 2-meter social distancing rule, it slowly became nearly possible to run on those routes without getting too close to other runners and pedestrians.
In my previous map blog where I mapped all my Strava activities since 2017, I noticed that I have not really explored too much around my neighborhood. All my hills runs are almost all in the Pacific Spirit Park near UBC. All my flat fast tempo runs are all on the seawall around Stanley Park and False Creek. I realized that I do not know much at all of the terrains in Vancouver.
Lately, I found a new hill run routes from Cornwall (Kits beach) to 8th Ave. It is short, punchy, and more importantly, it is close to where I live and not many runners are running on that route. I had a few decent hill repeats on that route and now am seeking an alternative for my flat tempo run routes around my apartment. So, I decide to map all the hills in Metro Vancouver.

First thing first, a bit math and engineering. The steepness of a hill is often expressed as slope and gradient (%). It requires two variables — rise, and run. Rise refers to the vertical difference in elevation between two given points and run is the horizontal distance between these two points. A steeper hill is (in most cases) a result of a great rise over a short run.
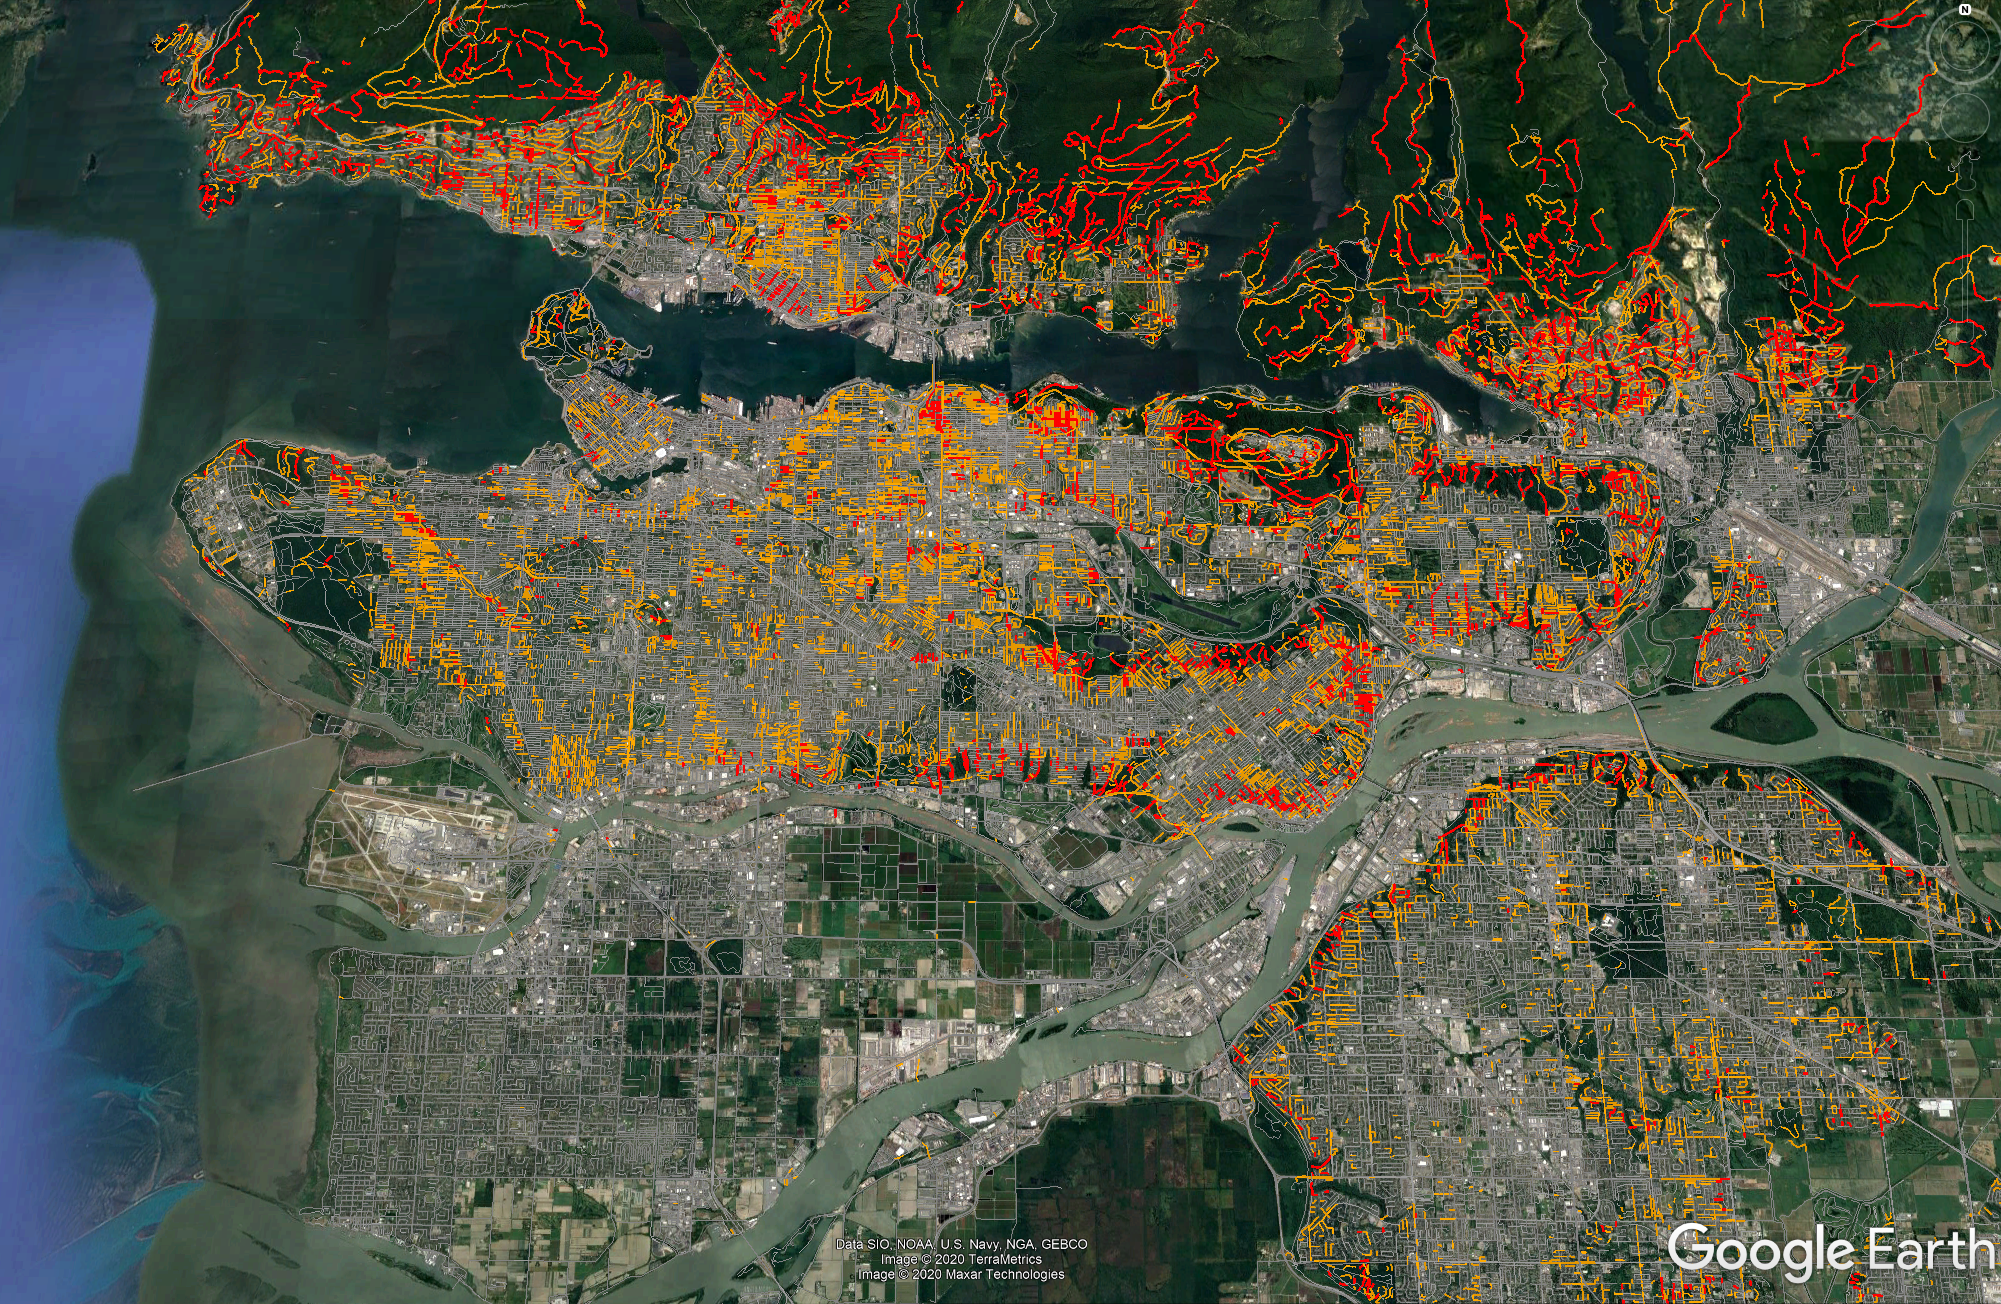
I divided all streets from Metro Vancouver’s open data to many 100-meter segments and extracted the elevation from the start and end point of each segment. The gradient (%) you will see in the map below is simply the ratio between the rise (elevation difference between start and end points) and the run (constantly 100-meter).

I have also made a KML (also known as KMZ) file so you can load this map to Google Earth (not Google Map) and plan your next social distancing run. When you open the file in Google Earth it should like the image below. If you click any of the street, there will be a pop up window that tells you exactly what the gradient is for this segment.
Download the KML from here.
It is now “up” to you to run towards or away from the hills.
But remember, what goes up will eventually go down ;)