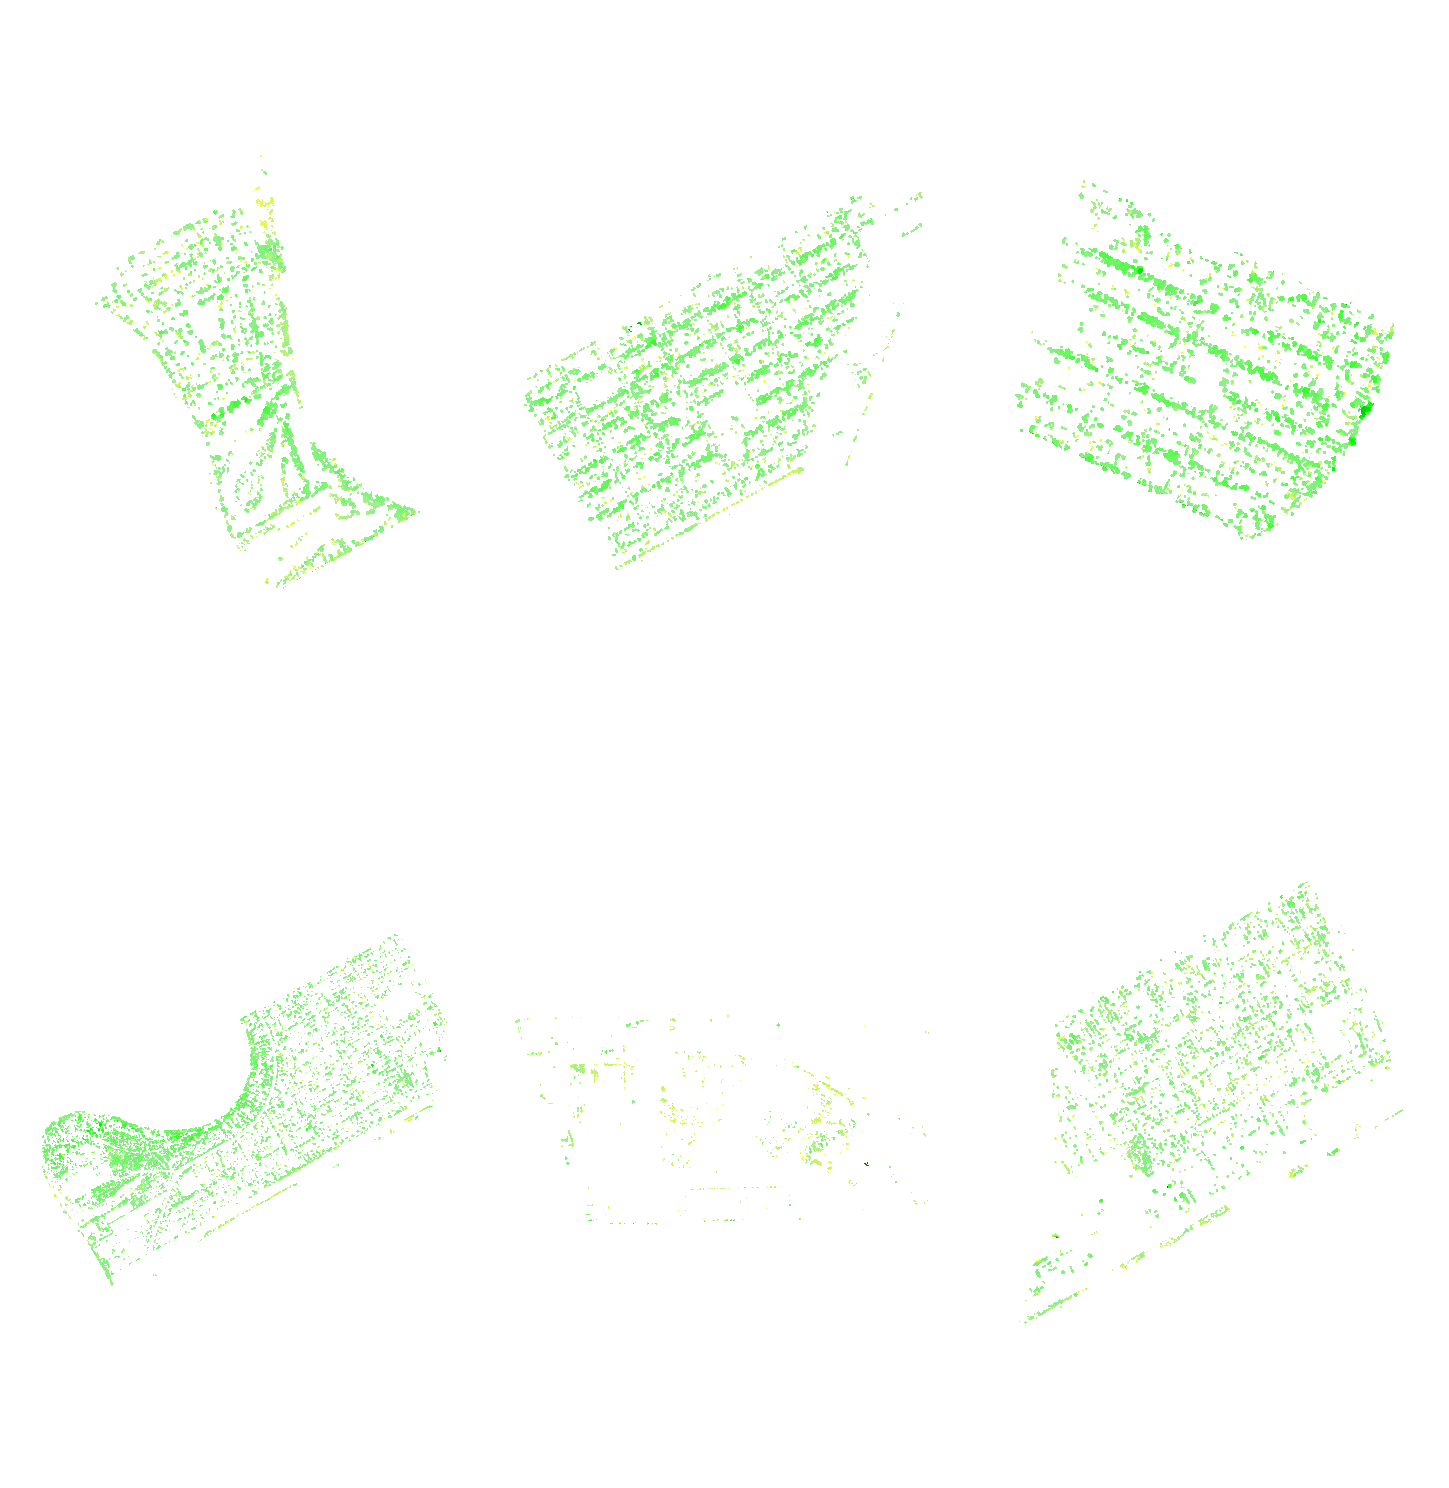
Winnipeg individual tree canopy data
Yuhao Lu (PI) and Zach Pankratz (B.Ed)
last update: October 2024
Data can be accessed here (231MB, ~2GB unzipped).
Over 1.4 millions trees were mapped.
key attributes include:
Z: tree height (m)
cnvhll_: canopy size (m2)
density: canopy density (%)
wpg_name: neighborhood name
Many thanks to Compute Canada for hosting this dataset and URGP for partially funding this work.
Methods
The objective of this procedure is to geographically identify, extract, and delineate individual tree crowns, while computing tree height (m), crown size (m²), and crown density (%) for each tree, including both public and private trees. The primary data source for this process was Winnipeg’s 2021 city-wide aerial laser scan (ALS). A total of 794 ALS tiles (.las, version 1.2) were downloaded and reprojected to NAD UTM 14N (EPSG: 32614). Each tile contained a point cloud (XYZ values), where each point carried additional attributes such as LAS classification code, elevation, and intensity. Points with identical XYZ values were removed before proceeding with further analysis. This procedure was conducted in R (R Core Team, 2024) using the following packages: lidR (Roussel, Auty, & Coops, 2020), terra (Hijmans, 2022), and rgl (Murdoch & Adler, 2019). The R script can be downloaded from here.
The following workflow was applied to all 794 ALS tiles. First, a canopy height model (CHM) was generated by rasterizing the ALS point cloud (chm_als) with a 0.5 m pixel size, using only high vegetation class points to exclude buildings and other non-ground features. Next, individual tree top points (ttop) were identified using the lmf algorithm from lidR and then applied to the chm_als raster layer. The lmf method (Popescu & Wynne, 2004) detects tree tops based on a local maximum filter. A 5 m circular moving window was selected, based on processing efficiency and visual assessment of the resultant ttop layers against orthomosaics (Winnipeg Open Data, 2024). Finally, chm_als and ttop were combined to segment individual tree crowns (crowns_als) as convex polygons, using an algorithm developed by Dalponte and Coomes (2016).
Since lidR was developed for forestry applications, its performance in urban environments has not been extensively tested. Therefore, several filtering steps were employed to ensure the accuracy and quality of the final tree dataset. First, trees shorter than 1 m or with a crown diameter less than 1 m were removed to balance processing time, file size, and the level of detail. Second, because the ALS was conducted in early fall, the average return intensity was used to exclude tree crowns with an average intensity above 95%, as these likely corresponded to highly reflective surfaces (e.g., small roofs, vehicles). Lastly, tree canopies with fewer than five returns per polygon were also removed.
After visually comparing the results with high-resolution orthomosaics and Winnipeg’s public tree inventory (Winnipeg Open Data, n.d.), we found that the process also incorrectly delineated objects that resembled trees, such as utility poles and small sheds in open areas. To reduce these false positives, we calculated the average tree height per crown polygon using the latest 1 m global canopy height model (chm_meta) from Tolan et al. (2024). Tree crowns in crowns_als with a height of less than 1 m in chm_meta were classified as false positives and removed. We made a short video on how to access this global datasets using Earth Engine.
In light of the increasing urban heat island effect and the lack of a city-scale quantitative measure of canopy shading, individual canopy density (%) was estimated by calculating the ratio between the number of ground return points and the number of high-vegetation points per crown (Lu et al., 2022).
Please note that this dataset is developed as an ongoing research into the urban digital twin at our lab. A future release/update might occur when improvements are made.
References
Adler, D., Murdoch, M. D., Suggests, M. A. S. S., WebGL, P. L. Y., OBJ, S., & OpenGL, S. (2019). Package ‘rgl’.
Dalponte, M., & Coomes, D. A. (2016). Tree‐centric mapping of forest carbon density from airborne laser scanning and hyperspectral data. Methods in ecology and evolution, 7(10), 1236-1245.
Hijmans, R. J., Bivand, R., Forner, K., Ooms, J., Pebesma, E., & Sumner, M. D. (2022). Package ‘terra’. Maintainer: Vienna, Austria.
Lu, Y., McCarty, J., Sezto, J., Cheng, Z., Martino, N., Girling, C. & Matasci, G. (2022). Modeling the shading effect of Vancouver’s urban tree canopy in relation to neighborhood variations. Arboriculture & Urban Forestry (AUF), 48(2), 95-112.
Popescu, S. C., & Wynne, R. H. (2004). Seeing the trees in the forest. Photogrammetric Engineering & Remote Sensing, 70(5), 589-604.
R Core Team (2024). _R: A Language and Environment for Statistical Computing_. R Foundation for Statistical Computing, Vienna, Austria. <https://www.R-project.org/>.
Roussel, J. R., Auty, D., Coops, N. C., Tompalski, P., Goodbody, T. R., Meador, A. S., & Achim, A. (2020). lidR: An R package for analysis of Airborne Laser Scanning (ALS) data. Remote Sensing of Environment, 251, 112061.
Tolan, J., Yang, H. I., Nosarzewski, B., Couairon, G., Vo, H. V., Brandt, J., & Couprie, C. (2024). Very high resolution canopy height maps from RGB imagery using self-supervised vision transformer and convolutional decoder trained on aerial lidar. Remote Sensing of Environment, 300, 113888.
Winnipeg Open Data. (2021). Map of 2021 orthographic photography tiles. City of Winnipeg. https://data.winnipeg.ca/City-Planning/Map-of-2021-Orthographic-Photography-Tiles/4gcd-nan4
Winnipeg Open Data. (n.d.). Tree inventory. City of Winnipeg. https://data.winnipeg.ca/Parks/Tree-Inventory/hfwk-jp4h/about_data

